
What You’ll Learn
By the end of this guide you will be able to read the two drift lines and what their crossings mean, use the underlying and VWAP overlays for market context, reconcile the premium view (Panel 1) with the contract-count view (Panels 2–3), and know which situations the chart reads well — and which it cannot.What Net Drift Is
The GEX views measure gamma — the hedging-pressure side of options activity. Net Drift measures the money: for every minute of the session it nets buyer-leaning premium against seller-leaning premium, separately for calls and puts, and accumulates the result into two running lines. The green line is the session’s net call-side premium; the red line is net put-side premium. Watching them race, stall, and cross is watching the day’s directional participation build in real time.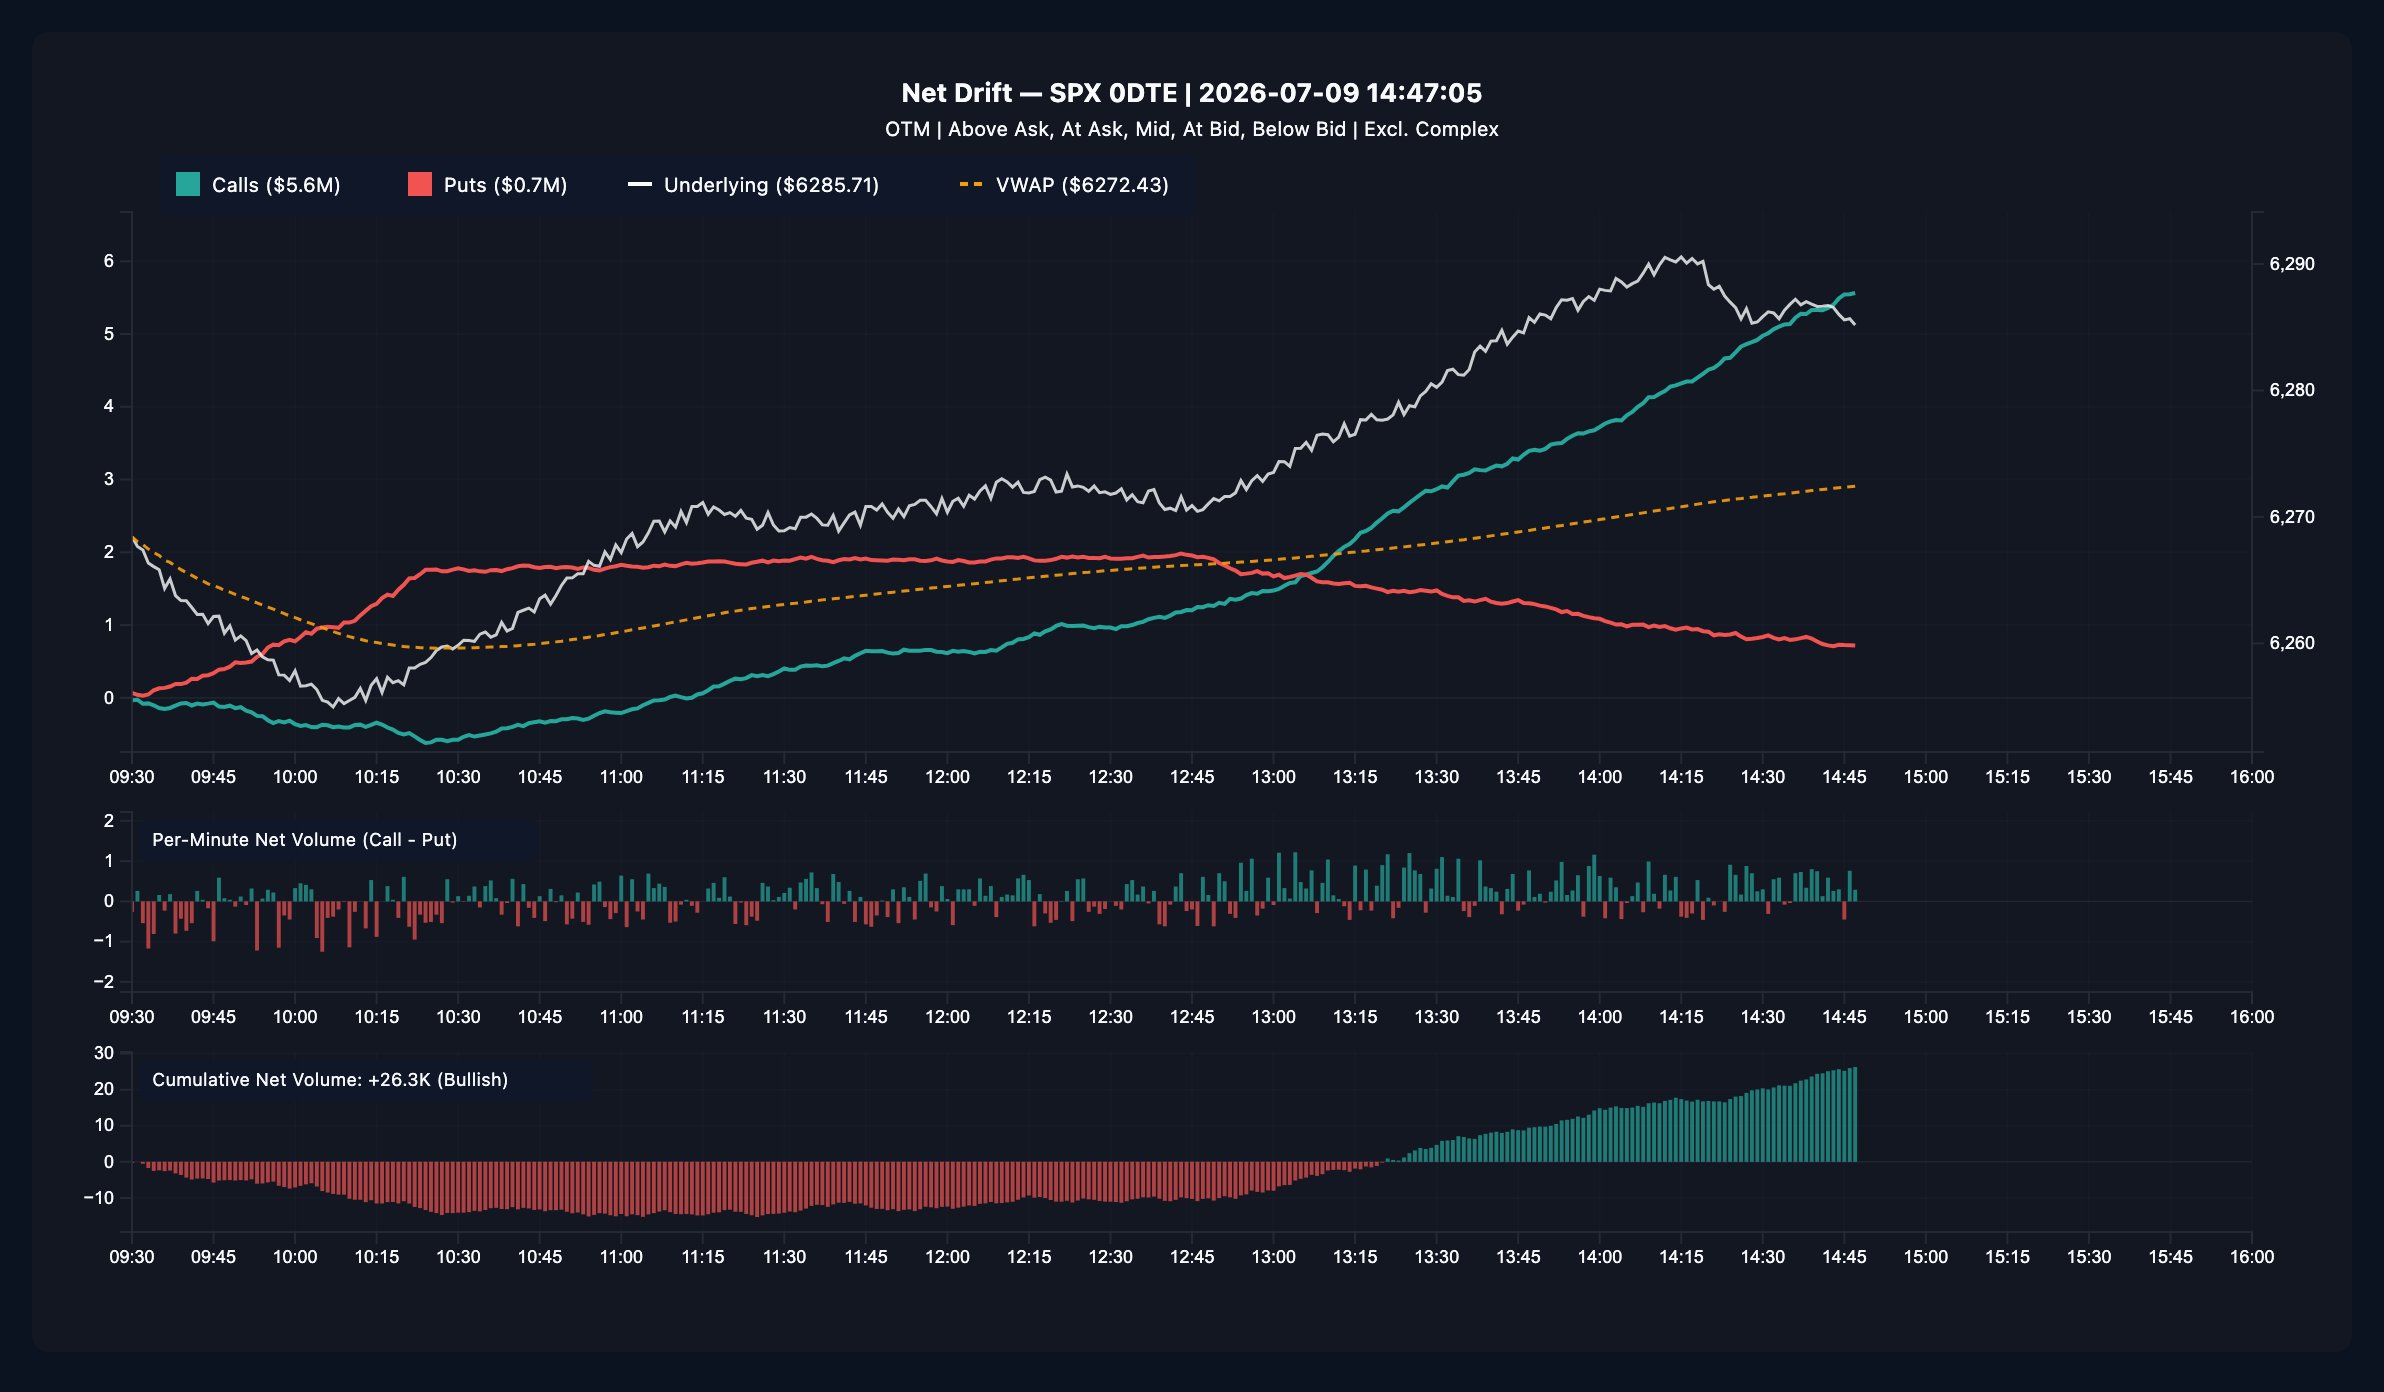
Panel 1 (top): Cumulative Net Drift
What you see:- Teal line — cumulative net call premium: call buying minus call selling, in dollars (left axis, scaled — the legend shows the unit)
- Red line — cumulative net put premium, same construction
- White line — the SPX price (right axis)
- Dashed amber line — the session VWAP, anchored at 9:30 ET (right axis)
- A line rising = that side is net accumulating premium. A falling line means selling pressure (closing or writing) currently outweighs buying on that side.
- The gap between the lines is the day’s directional lean in premium terms. Widening gap = one side pulling away.
- A crossing = the session’s cumulative lean has flipped. In the screenshot the call line’s cross above the put line coincides with spot breaking over VWAP — the kind of agreement worth noticing.
- Both lines rising together = active two-way participation. Not noise: hedging and speculation are both engaged, and the next divergence tells you which won.
Panel 2 (middle): Per-Minute Net Volume
Labeled Per-Minute Net Volume (Call - Put). Each bar is one minute’s net contract lean after netting buys against sells on each side: teal bars = the minute leaned call-side, red bars = put-side. This is the when panel. The drift lines smooth the story; the bars show the bursts that wrote it. A cluster of tall teal bars marks a call surge you can then locate on GEX Interval to see which strikes absorbed it.Panel 3 (bottom): Cumulative Net Volume
The running sum of Panel 2, with a label stating the current total and its direction — e.g. Cumulative Net Volume: +26.3K (Bullish). This panel is the premium panel’s cross-examination. Panel 1 counts dollars; Panel 3 counts contracts. They usually agree — when they do not, the difference is meaningful:- Premium bullish, contracts bearish: the call side’s dollars came from fewer, larger prints. Size concentration, not breadth.
- Premium bearish, contracts bullish: many small call buyers against fewer large put buyers. Breadth without size.
The Crosshair
Hover anywhere and the crosshair snaps to that minute, marks all four series, and shows: Call Drift, Put Drift, SPX, VWAP, Min Vol (that minute’s net volume), and Cum Vol (the running total). Use it to timestamp turning points — “the put line peaked at 12:55” is a more useful observation than “puts were strong today.”Why It Helps
- It shows participation, not just structure. GEX tells you where hedging pressure sits; Net Drift tells you whether traders are actually paying up on the call side or the put side today, and when that changed.
- It gives moves a premium context. A rally with a rising call line and a falling put line has options participation behind it; a rally with both lines flat is happening without the options crowd.
- The two-currency check (dollars vs. contracts) catches distortions a single-metric chart would hide.
How To Use It Well
1
Check freshness and filters
The title’s timestamp, the Updated N min ago badge (live views refresh
every 1 minute), and the subtitle’s filter list tell you exactly what you
are reading.
2
Read the gap, then the slope
Which line is on top, and is the gap opening or closing? Then check whether
the leader is still rising — a leader that has gone flat is a lead being
defended, not extended.
3
Locate the turning points
Crosshair the spots where a line inflects or the lines cross, and note the
time. Then look at the same minutes on Panel 2 for the bursts that caused
them.
4
Cross-examine with contracts and urgency
Confirm Panel 1’s story against Panel 3’s contract count, then against
Net Flow’s ask-side-only view. Three agreeing reads are
worth far more than one.
5
Tie it back to the levels
Premium flow says push; the GEX views say where pushes stall or extend.
A call-side surge into a large positive-GEX wall on
GEX Combined is a different situation from the same
surge into open air.
Common Misreads
- “The call line is rising, so buy calls.” The line describes premium that has already printed — often on a move already in progress. It is context, not a signal.
- “A falling call line means traders are bearish.” It means call-side selling outweighs buying — which can be profit-taking into strength just as easily as a bearish turn. Check spot.
- “Both lines rising = confusion.” It is two-way participation, and it is informative: watch which side accelerates out of it.
- “Panel 3 repeats Panel 1.” Dollars versus contracts. Their disagreements are some of the most useful reads on the chart.
- “Flat lines mean a dead session.” Net Drift nets buys against sells. Heavy but balanced trading nets toward zero — the flat line hides real volume, which Panel 2’s bars will still show.
Strengths and Limitations
Where Net Drift is strong- It is the cleanest view of directional options participation through the day — netted, split by side, and time-stamped.
- The premium/contract double-entry design self-audits: divergences between the two are surfaced instead of averaged away.
- Mid-market prints are excluded honestly rather than force-classified, so the netting is built only from prints with directional information.
- Buy/sell classification is a heuristic based on where prints landed relative to quotes. It is good on average and wrong on individual prints.
- Excluding mid-market prints means a meaningful slice of volume — often a third — contributes nothing to the lines. On mid-heavy days the drift understates activity.
- Net premium cannot distinguish opening from closing trades: a rising call line can be new longs or shorts covering.
- It covers SPX 0DTE only and describes the flow’s lean, not future price.