
What You’ll Learn
By the end of this guide you will be able to read all three panels of the GEX Combined chart, use the Spot, Flow, P1, and N1 reference lines to frame the day’s key levels, check what is really behind a wall with the crosshair, and know when the chart’s read deserves less weight.What GEX Combined Is
GEX Combined is the map of the day’s gamma landscape. It takes every classified SPX 0DTE options trade since the open, converts it into gamma exposure, and lays the result out by strike price so you can see — in one pass — where the market has built stabilizing gamma, where it has built destabilizing gamma, and where spot sits relative to both.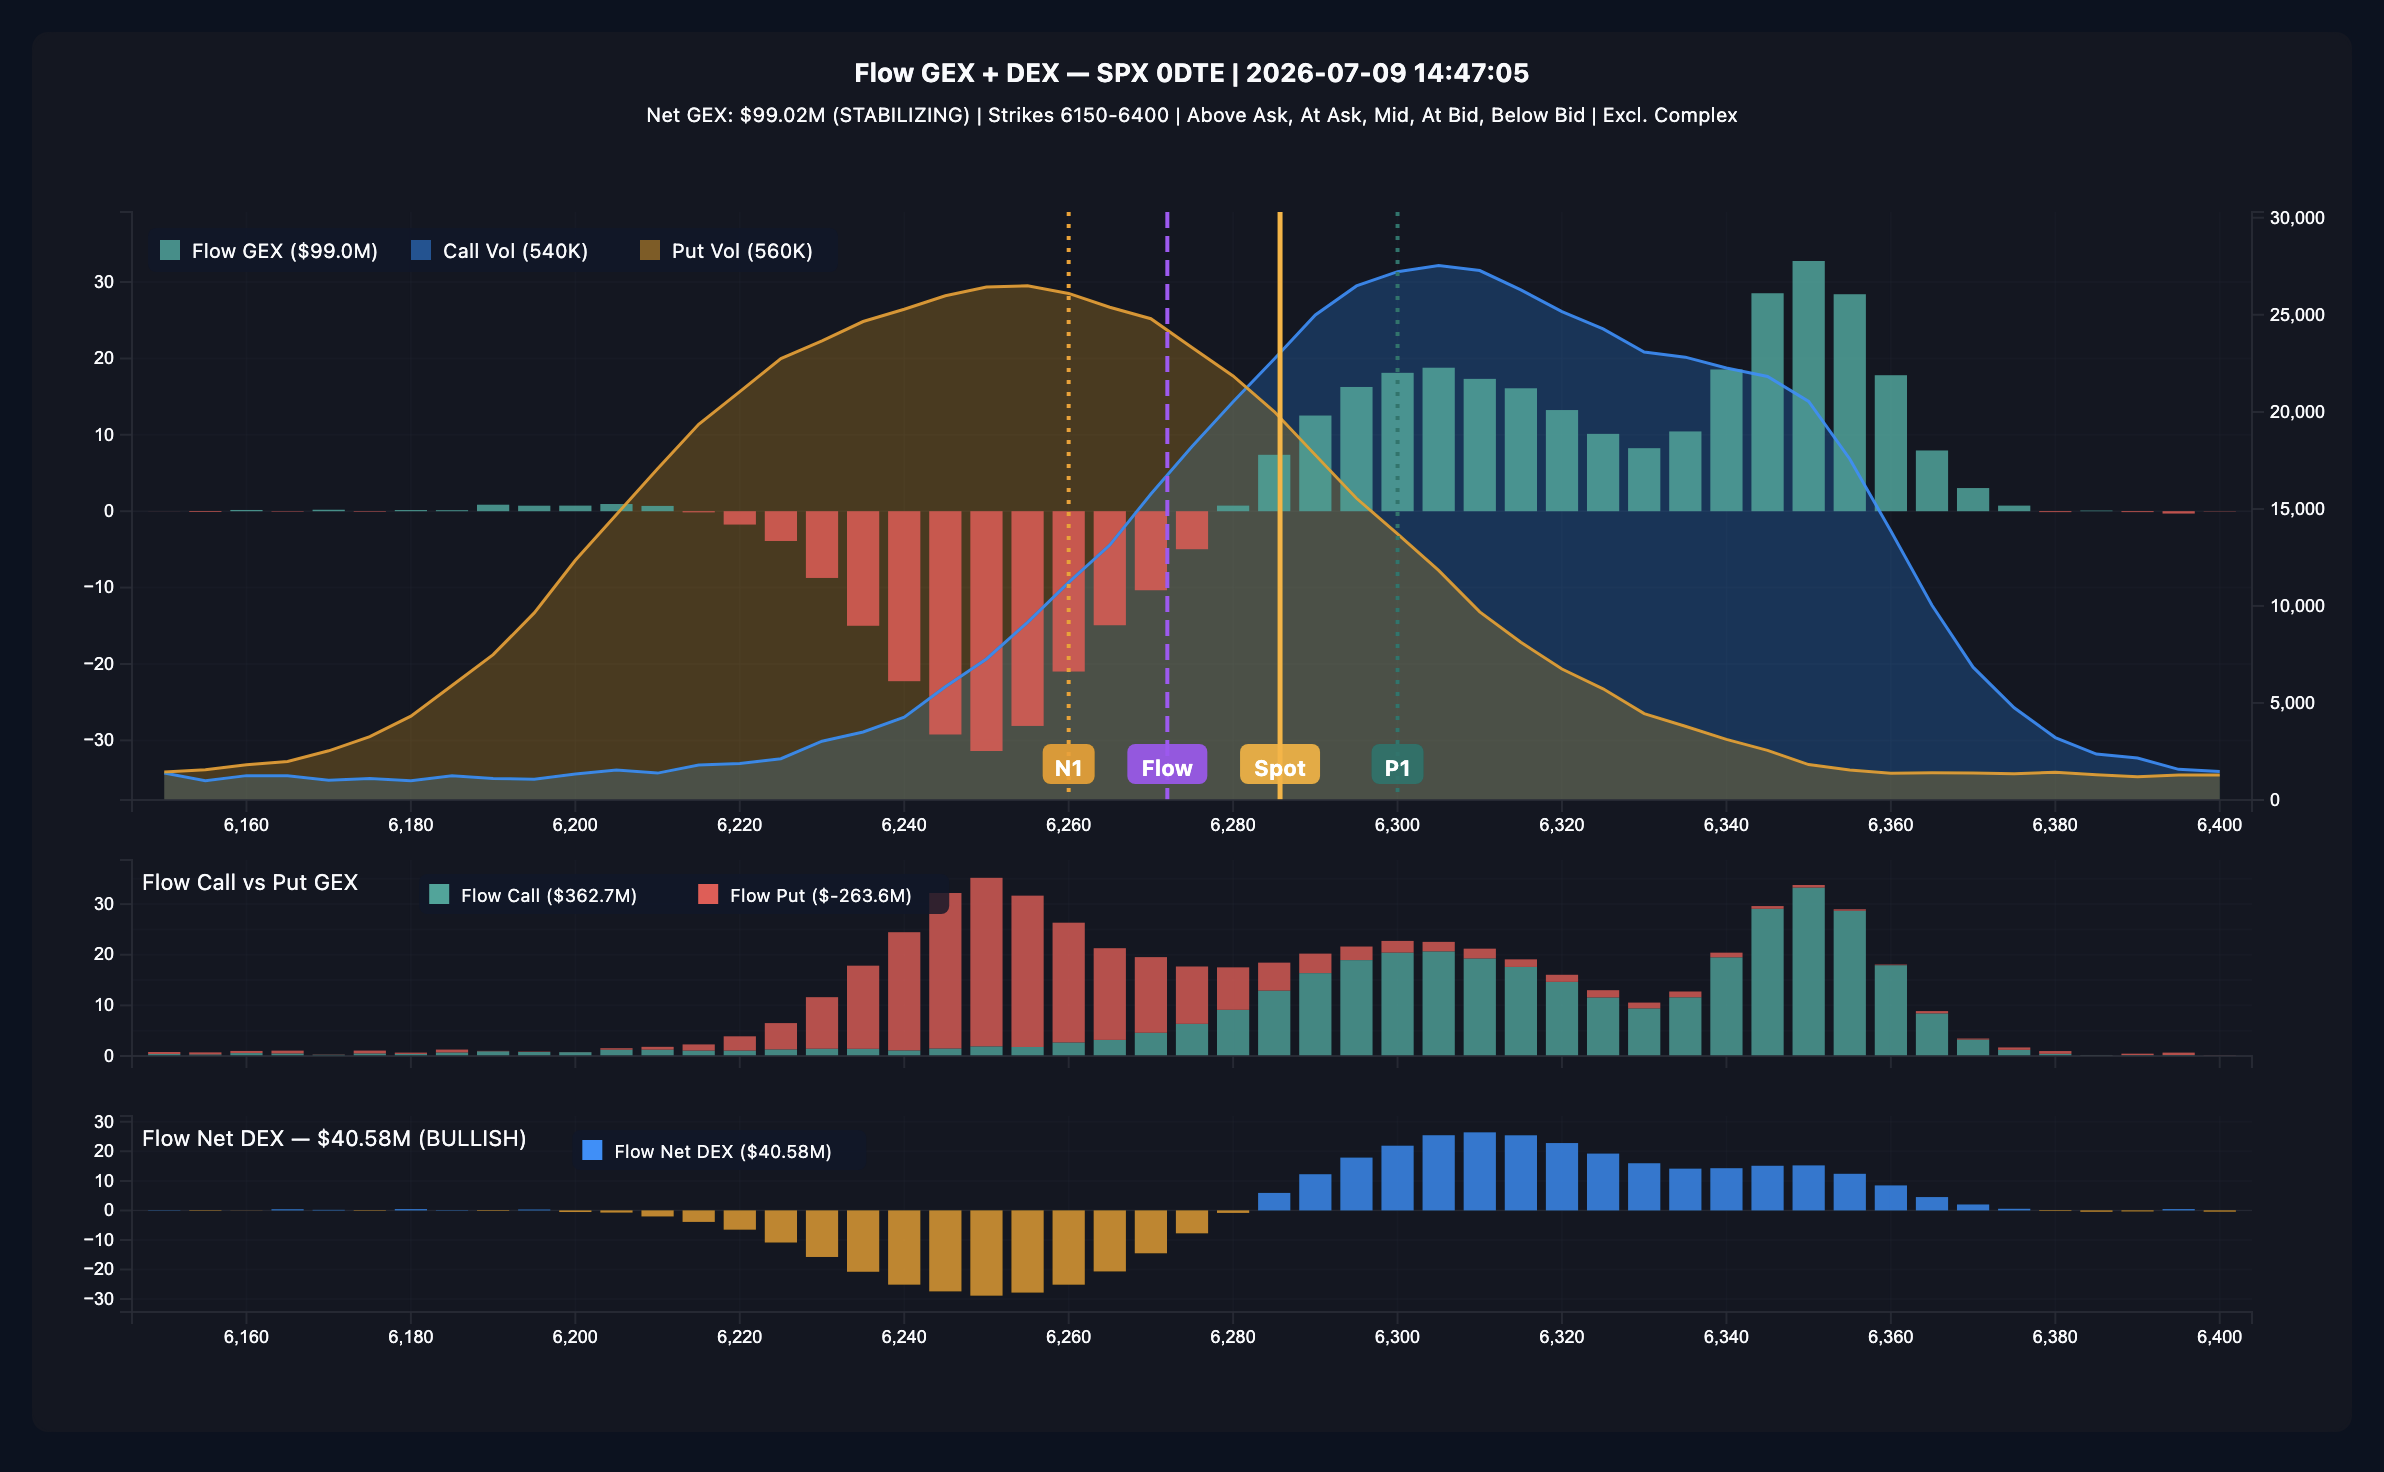
New to gamma exposure? Read the quick primer on the
GEX Analysis Overview first. The one-line version: positive
GEX areas can dampen price movement, negative GEX areas can amplify it, and
both effects are strongest on 0DTE options.
Panel 1 (top): The Gamma Wall + Volume
What you see:- Teal and red vertical bars — net flow GEX per strike, in millions of dollars (left axis). Teal = positive (stabilizing), red = negative (destabilizing).
- Blue and amber shaded curves — smoothed call volume (blue) and put volume (amber) in contracts (right axis). They show where the day’s trading activity is concentrated, independent of its gamma effect.
- Four vertical reference lines, each with a label pill at the bottom of the panel:
Hover (or keyboard-tab to) any pill and the chart explains it in a sentence.
One distinction matters enough to repeat here: the Flow line is the
crossing point of today’s trade flow, not the true open-interest gamma flip.
The open-interest flip lives on the GEX Ladder as the
Zero Gamma row. When the two disagree, today’s activity and the standing
structure see the balance point differently — that disagreement is information.
How to read it:
- Find Spot. Everything is relative to it.
- Scan up for the first tall teal bar — often tagged P1. That is the nearest stabilization candidate above.
- Scan down for the red zone — N1 marks its nearest edge. Movement into heavy red areas can accelerate rather than stall.
- Check the volume curves. A gamma wall sitting on heavy volume was built by real, sustained activity; a wall with thin volume came from fewer, larger prints and can be flimsier.
Panel 2 (middle): Flow Call vs Put GEX
What you see: stacked bars per strike showing the magnitudes of call GEX (teal, bottom) and put GEX (red, stacked on top). Both stack upward — this panel is about composition, not sign. How to read it: Panel 1’s net bar can hide what produced it. A strike that nets slightly positive because calls barely outweigh heavy put activity is a contested level; a strike that is positive on almost pure call GEX is a cleaner one. In the screenshot, the strikes around 6,250–6,270 are red-dominated in Panel 2 even where the net bar looks modest — the morning’s put positioning is still there under the surface.Panel 3 (bottom): Flow Net DEX
What you see: net delta exposure per strike — blue bars positive, amber bars negative. The panel title states the total and its direction, e.g. Flow Net DEX — $40.58M (BULLISH). How to read it: GEX tells you how strongly hedging pressure reacts to movement; DEX tells you which direction the hedging pressure already leans. The two together frame a level: a big positive-GEX strike with strongly positive DEX is a level where hedging has both a dampening effect and an upward lean.Panel 3 uses its own color pair (blue positive / amber negative) so you never
confuse it with the teal/red GEX panels above it.
The Crosshair: Auditing a Single Strike
Hover anywhere and a dashed crosshair snaps to the nearest strike, highlights that strike’s bar in every panel, and opens a tooltip: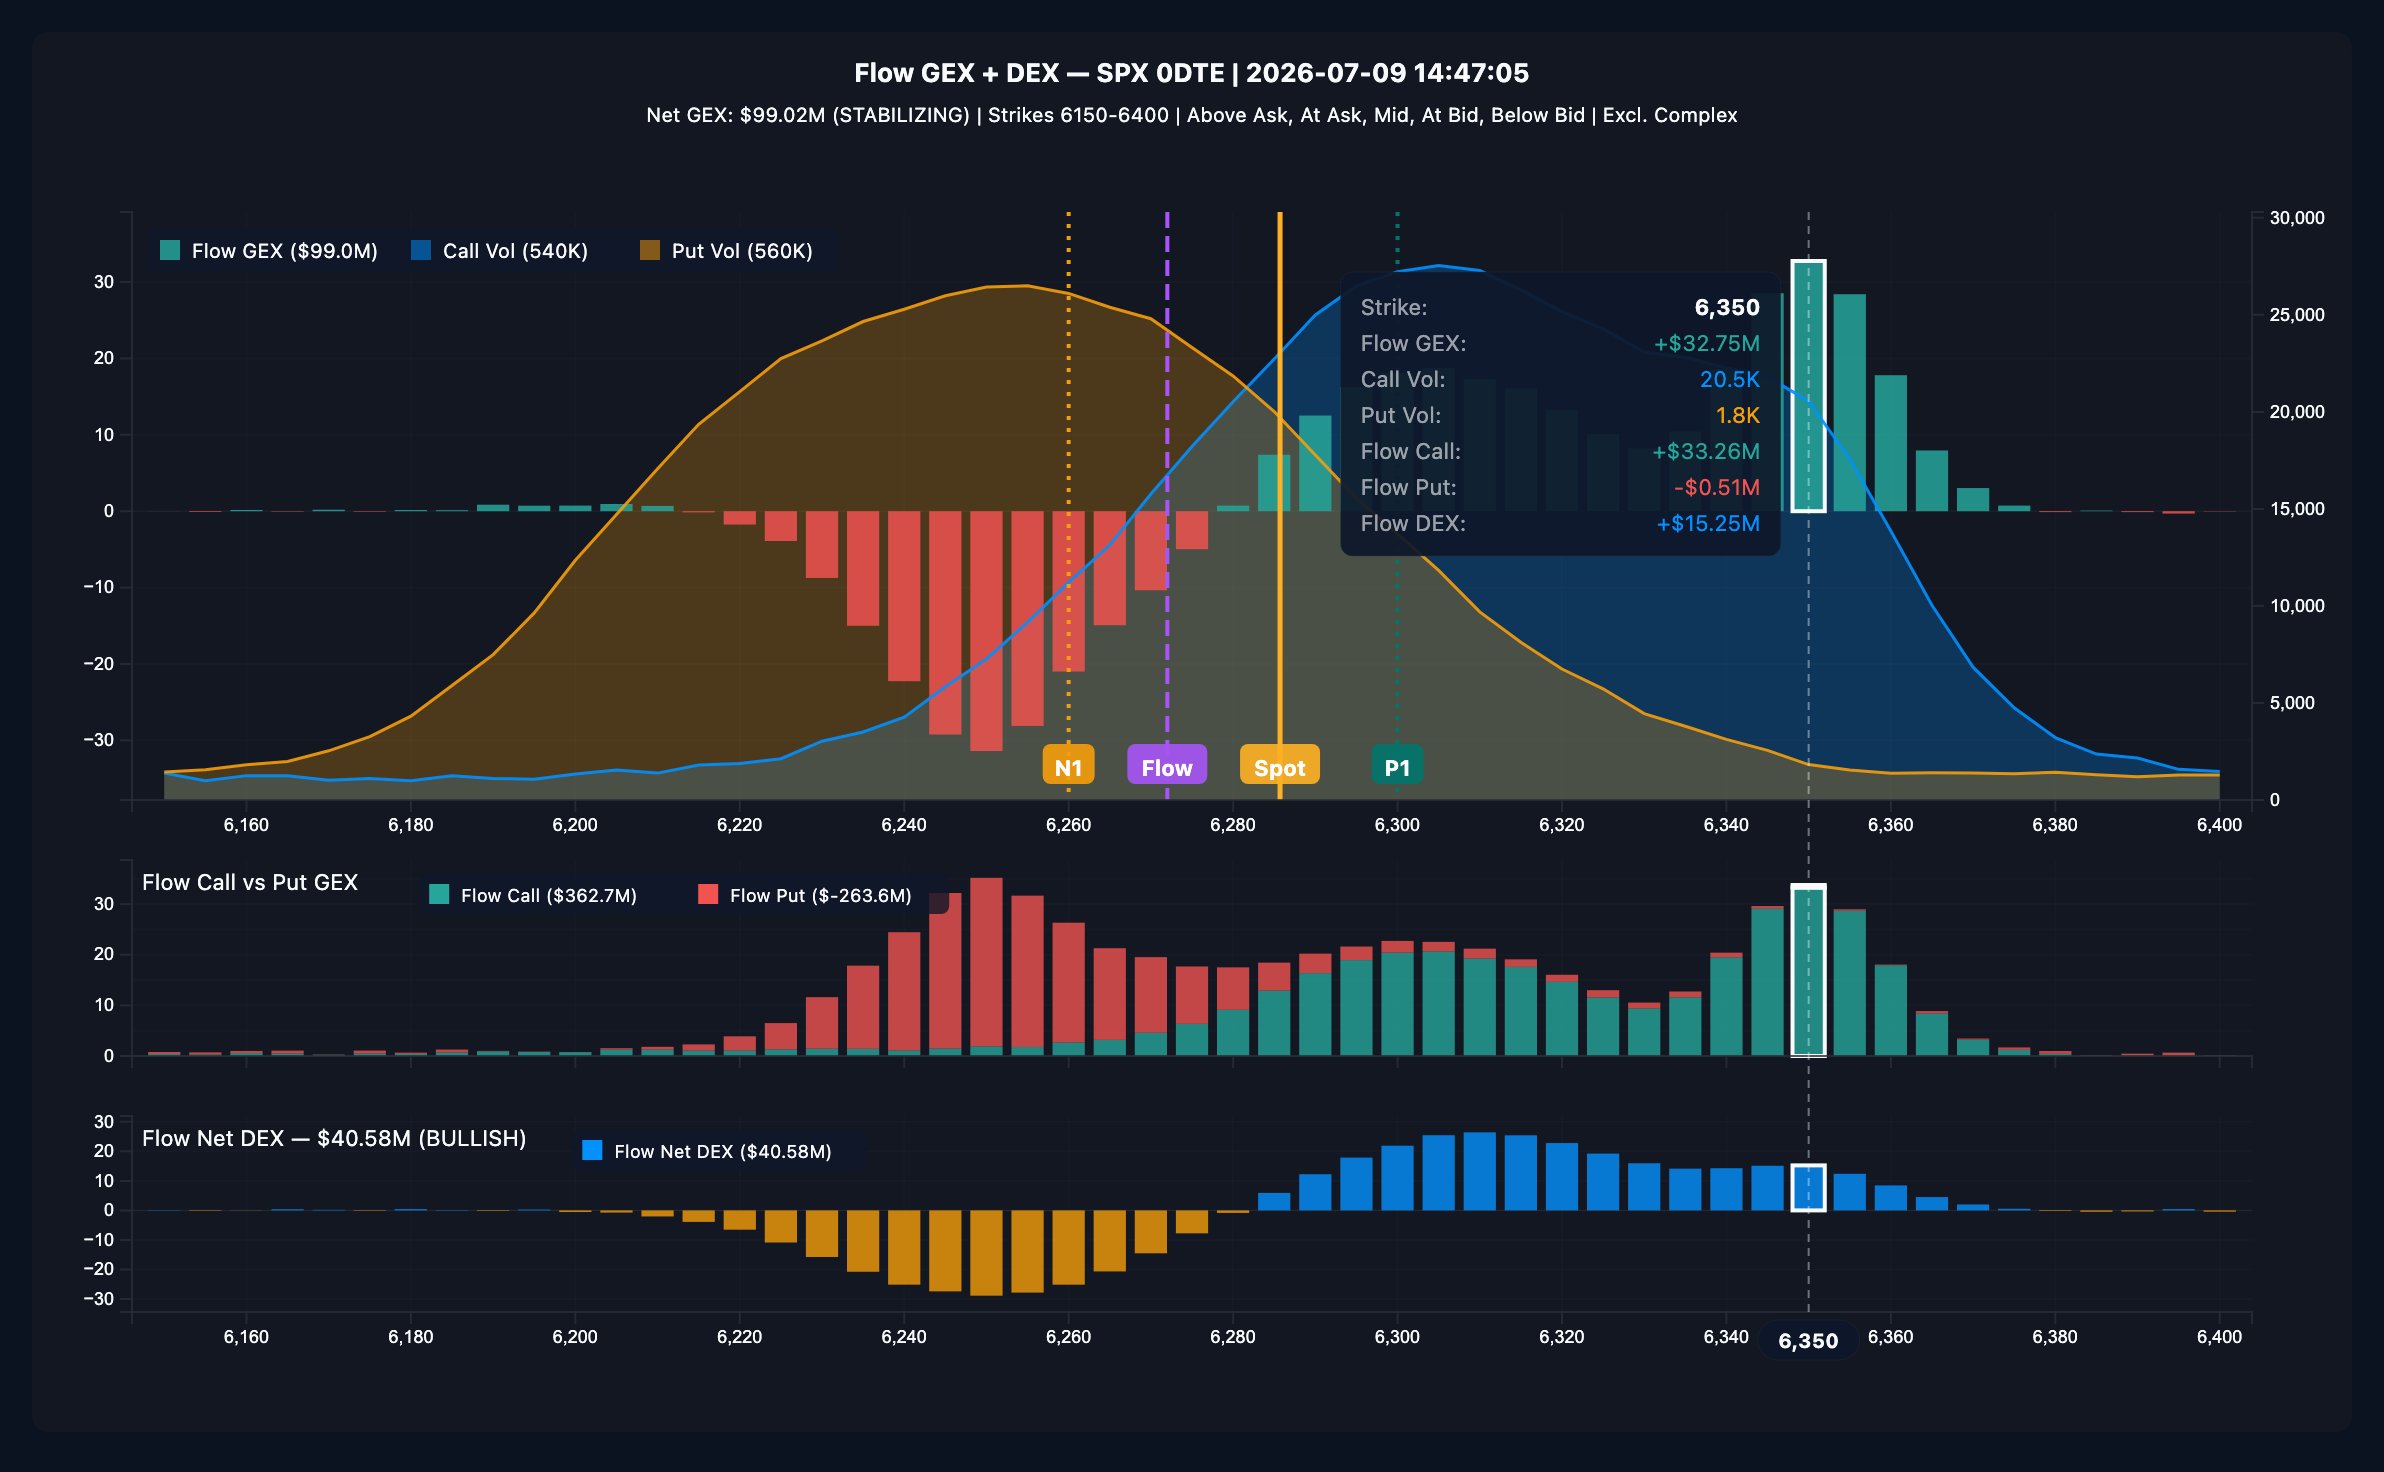
Use it before trusting any wall: the same +$30M net bar reads very differently
when it is 33M call GEX against −0.5M put GEX (clean) than when it is +80M
against −50M (a battleground).
Why It Helps
The chart answers three questions a new 0DTE trader otherwise has to guess at:- Where are the day’s working boundaries? The nearest big teal bar above and the red zone below frame the range that hedging pressure supports.
- Is the current area sticky or slippery? Spot in front of tall teal bars is in dampening territory; spot entering the red zone is in territory where moves can extend.
- Was this level built by real participation? Volume curves plus the crosshair separate levels built by sustained two-sided trading from levels a handful of prints created.
How To Use It Well
1
Read the subtitle first
Confirm the date, the as-of time, and the filters (e.g. OTM | … |
Excl. Complex). Live panels refresh every 1 minute and show an
Updated N min ago badge; historical dates show Loaded instead.
2
Frame the range from Spot
Locate Spot, then P1 above and N1 below. Those three lines are
the skeleton of the day’s map.
3
Audit the walls that matter
Crosshair the biggest bars near spot. Check volume and the call/put split —
one-sided, volume-backed walls deserve more respect than mixed thin ones.
4
Add timing and structure from the sibling views
GEX Combined shows where gamma is, not when it was built — check
GEX Interval for freshness. For the open-interest layer
and per-strike history, hover the same strikes on the
GEX Ladder. For the directional lean of premium,
read Net Drift and Net Flow.
5
Re-read into the afternoon
0DTE gamma decays and migrates fast. The morning’s wall may be gone by
3 PM — the chart repaints every minute, so let it.
Common Misreads
- “A big teal wall above spot is bullish.” It is a dampening zone — it can cap rallies just as easily as it steadies pullbacks. Direction comes from price and flow context, not from the wall’s existence.
- “The Flow line is the gamma flip.” It is today’s flow-balance crossing. The true open-interest flip is the Zero Gamma row on the GEX Ladder, and the two often sit at different strikes.
- “Net positive strike = call buyers.” Check Panel 2. A net-positive strike can sit on heavy put activity that is merely outweighed.
- “DEX repeats GEX.” GEX is reaction intensity; DEX is existing directional lean. A strike can be high-GEX and DEX-neutral, or the reverse.
- “The wall will hold.” Nothing here is a promise. Strong news flow can run through any gamma level; these are pressure maps, not barriers.
Strengths and Limitations
Where GEX Combined is strong- It is the most complete single picture of the day’s gamma terrain — net effect, composition, directional lean, and activity, all on one strike axis.
- The reference lines compress the map into four levels you can hold in your head, and each explains itself on hover.
- Because it is flow-based, it reflects today’s positioning within a minute of it printing — it does not wait for open-interest updates.
- It is flow-only: standing open-interest structure is invisible here. A strike can look quiet on this chart while carrying a large open-interest wall — cross-check the GEX Ladder’s Position GEX column.
- Trade classification is a heuristic. Mid-market prints carry no buy/sell information, and the dealer-positioning assumptions behind the sign convention can be wrong for any given name or day.
- It covers SPX 0DTE only — longer-dated hedging and other products do not appear.
- It refreshes each minute and describes hedging-pressure context; it does not predict direction.