
What You’ll Learn
How to use the Hermes Options Chart page, what each panel is showing, which controls matter, and how to compare short-dated SPY and SPX contracts quickly.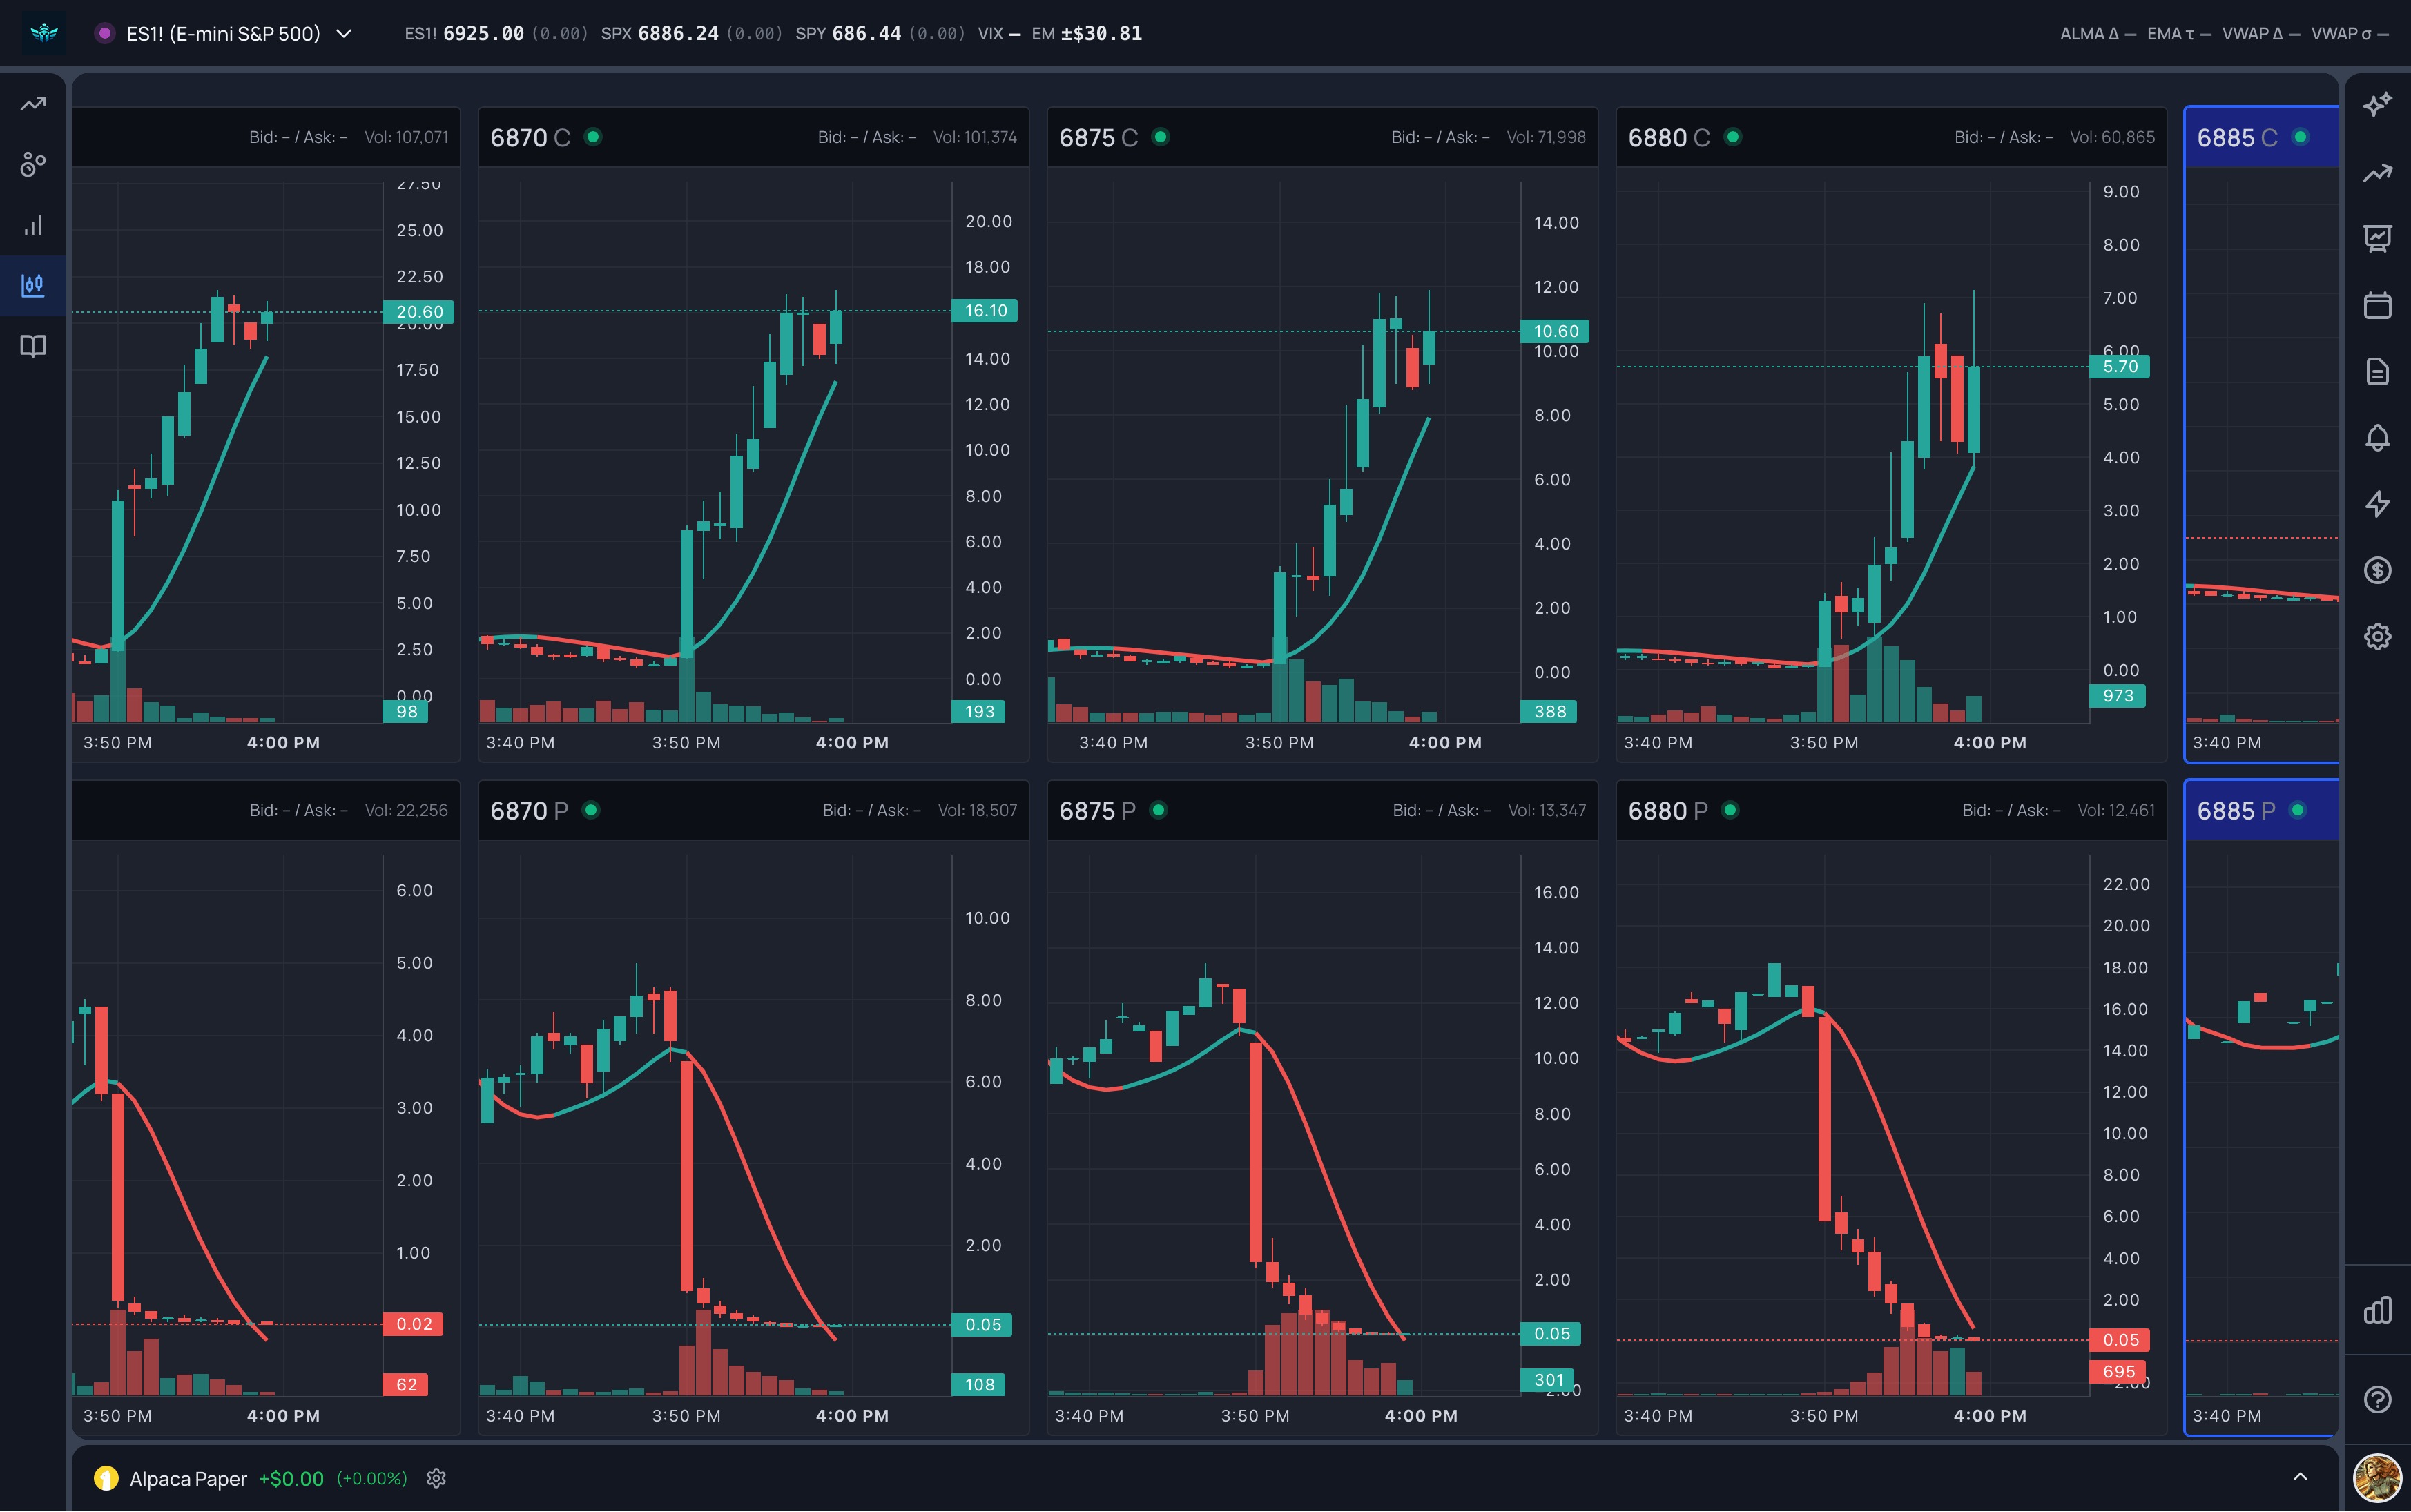
What You’re Looking At
The Options Chart page is a strike-by-strike view of the options chain rendered as charts instead of a table. Each column is one strike. Within that column:- the call chart is on top
- the put chart is below it
- the time axis is shared across the page so you can compare contracts at the same moment
What Users Can Do On The Page
From the Settings panel, you can change:- Underlying to switch between SPY and SPX
- Contract Date to move to a different expiration
- Strikes from ATM to show fewer or more contracts around the current price
- Chart Width to choose narrow, wide, or extra-wide
- scroll horizontally across strikes
- pan and zoom one chart and keep the other option charts aligned to the same time window
- compare how calls and puts respond during the same move
- watch the Tilson T3 line as a simple trend guide
Hermes keeps the option chart, surrounding strikes, and time alignment in one
workspace so you can compare structure without switching tools.
How To Read The Page First
Before drawing a conclusion from one contract, answer these questions:- Is the underlying trending cleanly or chopping?
- Are the near-ATM contracts expanding with the move, or stalling?
- Is price holding above or below the Tilson T3 line?
- Are calls and puts confirming the same story, or fighting each other?
Practical Review Workflow
This is one practical way to review the page for SPY.1. Start With Trend, Not With The Option
Use the page to decide whether the session is acting like:- an uptrend
- a downtrend
- a range you should avoid
2. Focus Near The Money
For quick SPY reads, start near the current price instead of reaching far out of the money. Why:- near-ATM contracts usually respond faster
- spreads are often more manageable
- the chart behavior is easier to read around pullbacks and trend continuation
3. Watch The Pullback To The Tilson T3
In an uptrend:- look for the contract to pull back toward the Tilson T3
- watch for buyers to defend that line
- note whether the trend starts resuming before the stretch becomes crowded
- use the same idea on puts
- wait for the option to pull back toward the Tilson T3
- note whether downside momentum starts expanding again
4. Exit Fast If The Trend Flips
This page is especially useful for noticing when the contract has stopped behaving cleanly. If the option loses the trend and starts holding on the wrong side of the Tilson T3, treat that as a warning that the read has degraded. For quick SPY reads, the practical point is to:- avoid over-staying a deteriorating structure
- preserve attention for the next clean setup
- compare the surrounding strikes before assuming one contract tells the whole story
5. Review The First Clean Continuation
For SPY 0DTE contracts, the first clean continuation can matter more than the full-day move. A common workflow is:- identify the trend
- wait for a pullback to T3
- watch whether resumption appears
- compare the continuation move across nearby strikes
- downgrade the read if trend structure breaks
Common Mistakes
- Chasing extension instead of waiting for structure to reset
- Over-weighting chop where calls and puts both look noisy
- Using a far OTM contract that moves too erratically
- Ignoring a T3 break after the option flips through the trend line
- Looking only at one contract instead of checking the surrounding strikes for confirmation
Practical Summary
Use the Options Chart page to compare strikes quickly, identify whether one side of the chain is trending cleanly, and time pullbacks to the Tilson T3. For fast SPY reads, the basic review loop is:- read the trend first
- watch the pullback to T3
- avoid over-weighting late extensions
- downgrade the read if the trend flips