
What You’ll Learn
By the end of this guide you will be able to open the GEX Ladder, find the strikes that matter around the current SPX price, read what each row is saying in plain English, and know when to trust the read — and when not to.What the GEX Ladder Is
The GEX Ladder turns the SPX 0DTE options landscape into a table you can scan in seconds. Each row is one strike price. A dashed amber spot price line slides between the rows at the exact current SPX price, updating live with each tick, and the row nearest spot stays highlighted. Strikes above the line sit above it, strikes below sit below it — like rungs on a ladder. Every row carries a heatmap bar, the gamma exposure numbers for that strike, and a plain-English Reason tag such as Pin Zone or Call Resistance.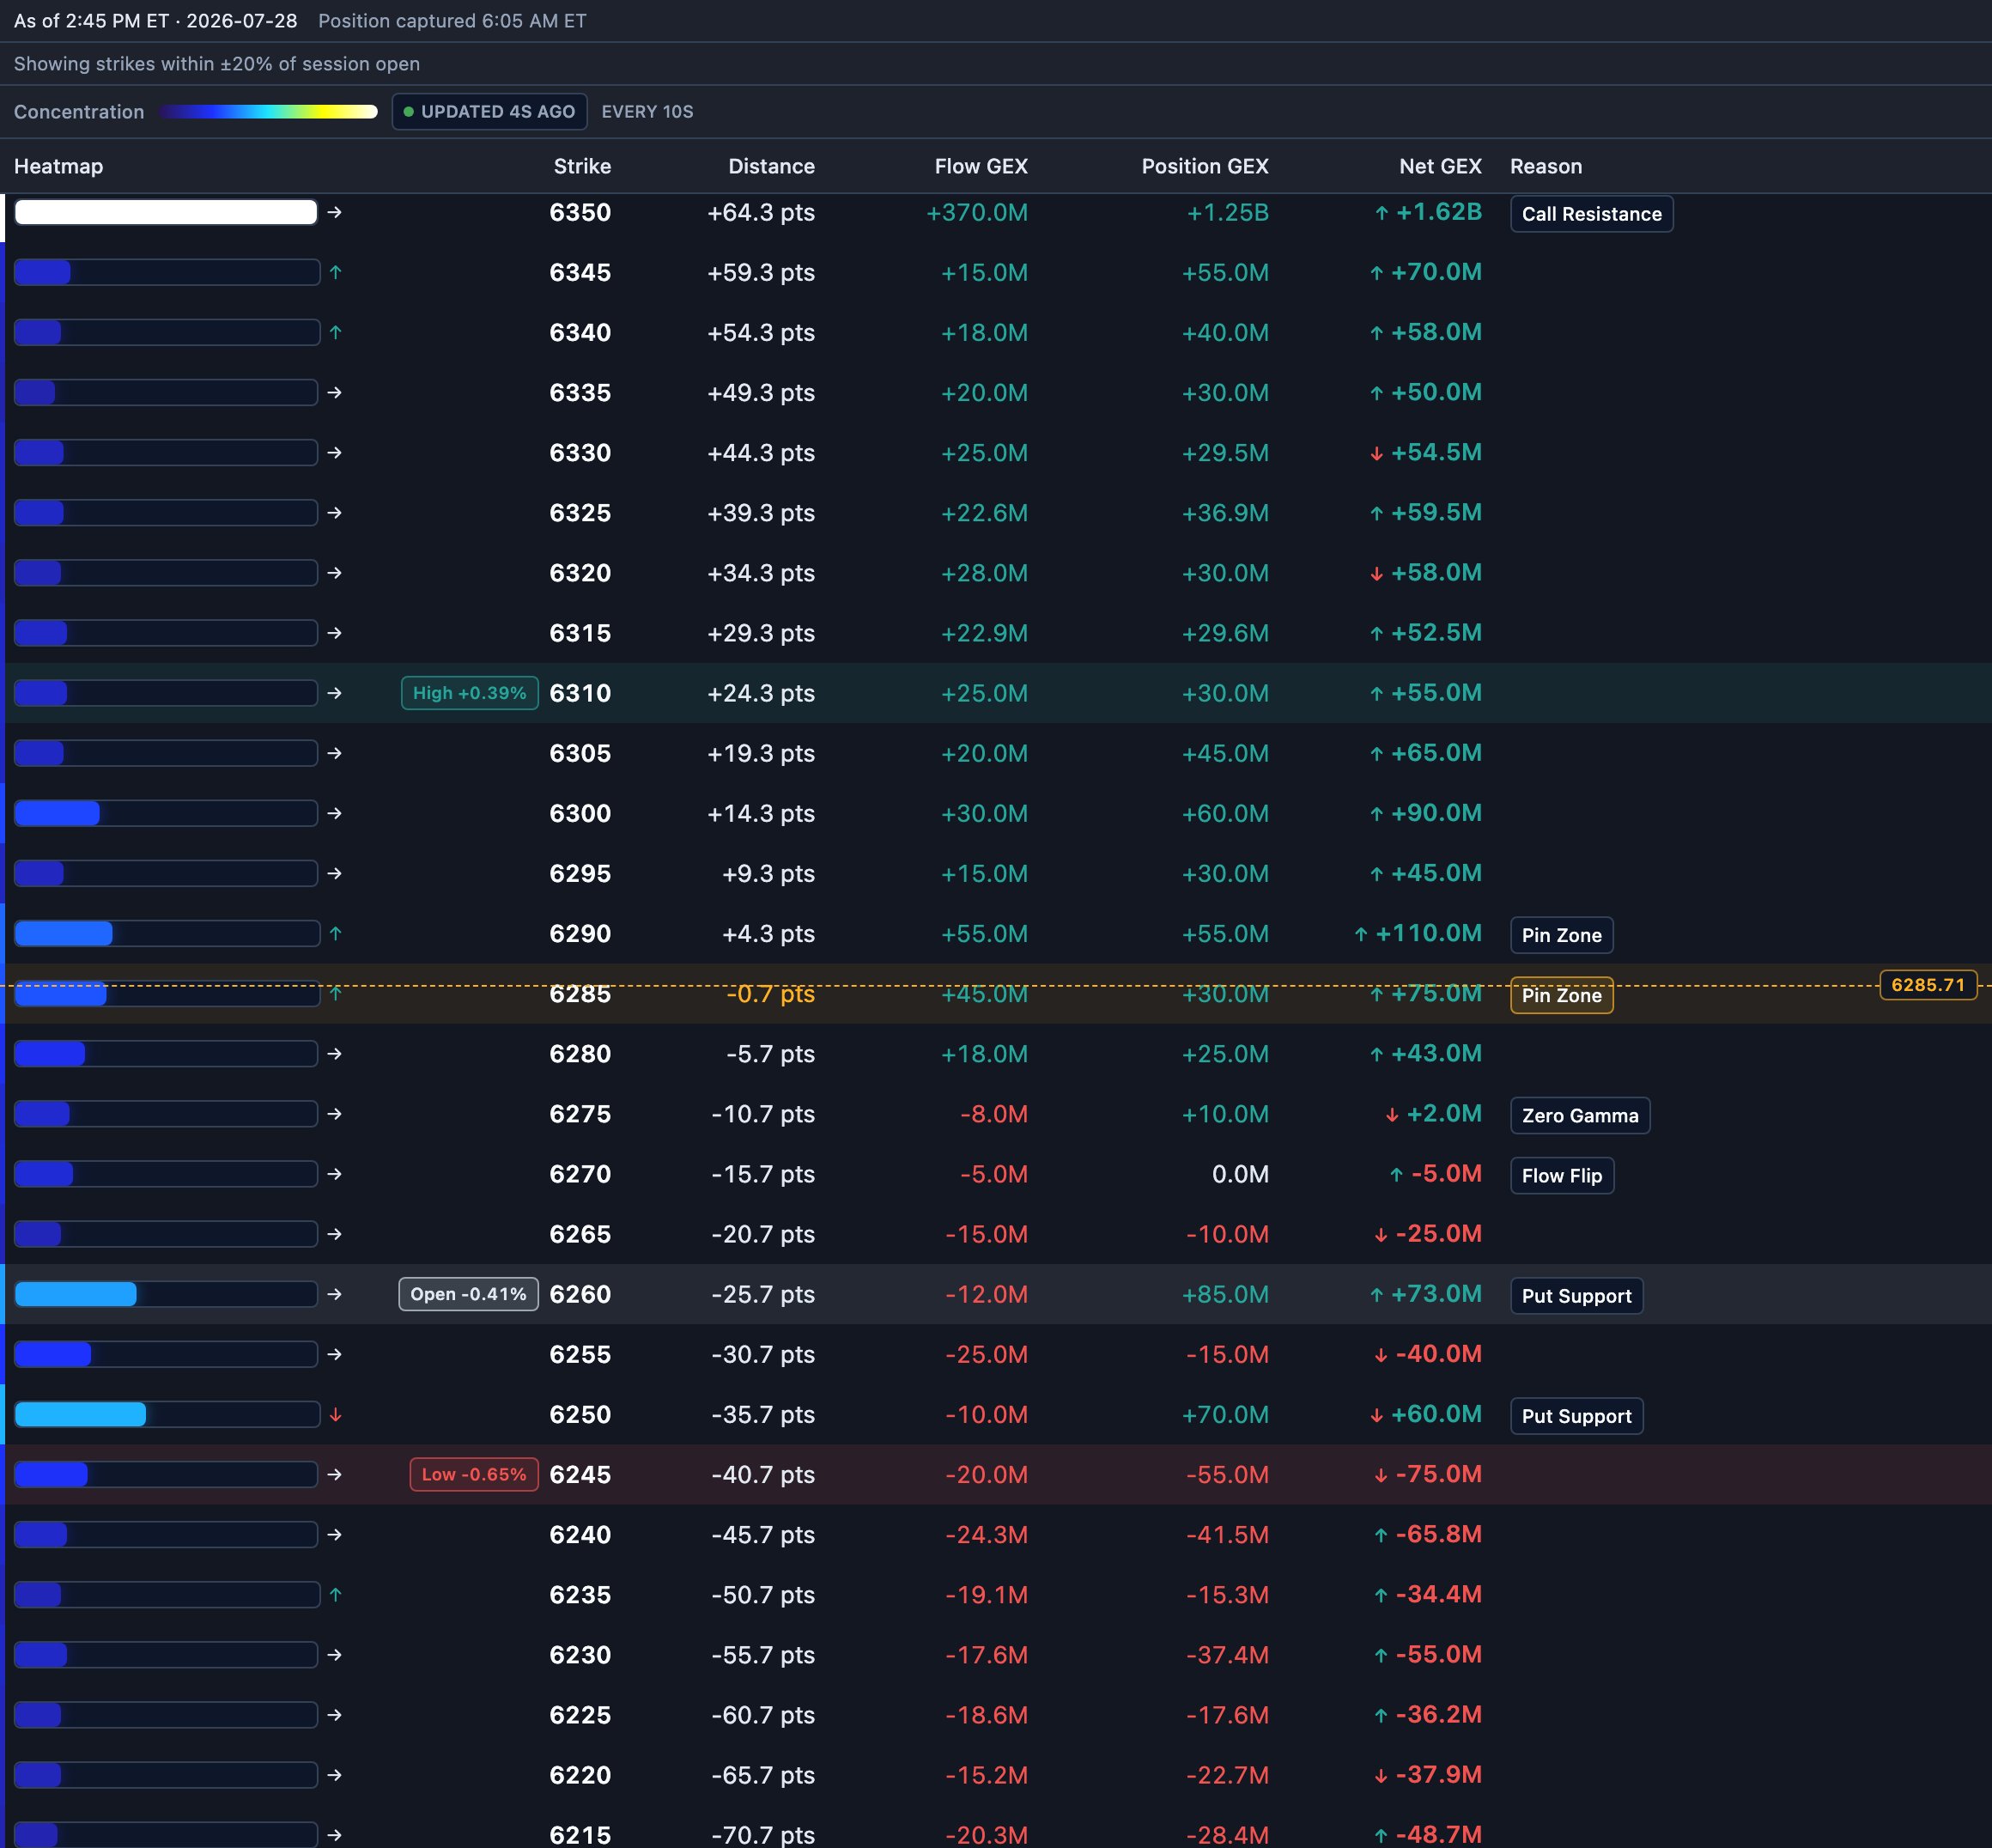
New to gamma exposure? Read the quick primer on the GEX Analysis Overview
first. The one-line version: positive GEX areas can dampen price movement,
negative GEX areas can amplify it, and both effects are strongest on 0DTE options.
The Three Numbers Behind Every Row
Every row is built from up to three measurements. Understanding the difference is the single most important part of reading the ladder:
Values are in millions of dollars (
+470.0M) and switch to billions when large
(+1.62B). Green means positive, red means negative. A -- means that measurement
is genuinely unavailable for that row — it is not a zero. A row can show --
for Position GEX because that strike is missing from the snapshot, while 0.0M
means “measured, and it nets to zero.”
How To Read a Row
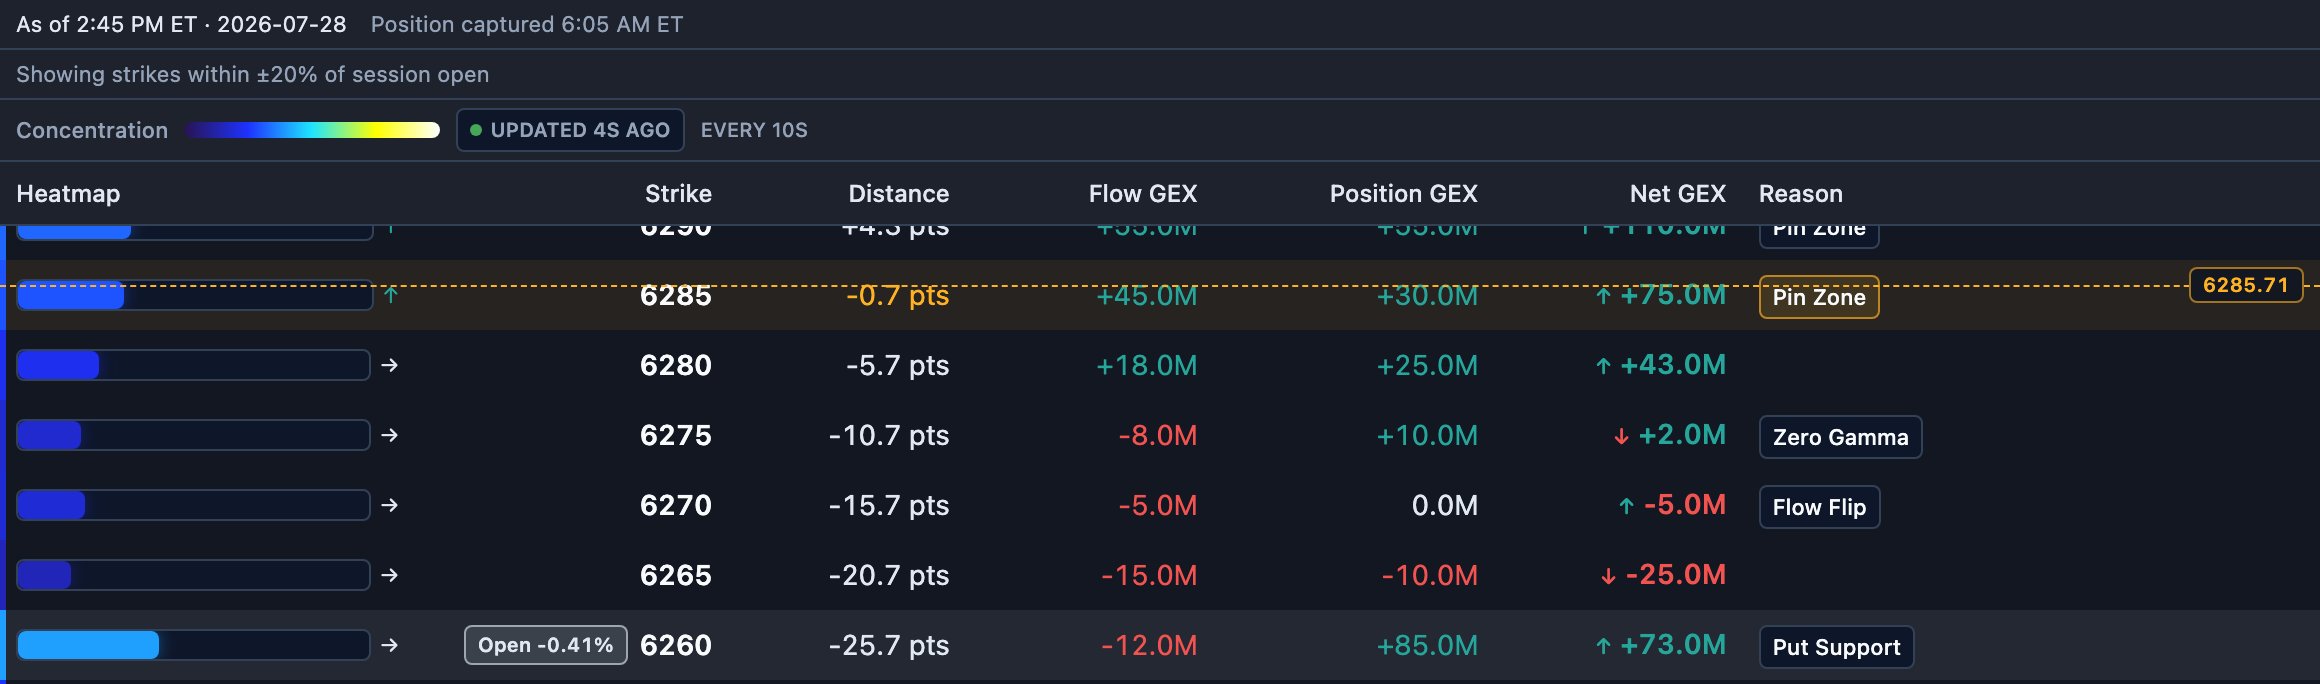
- Heatmap — the bar’s length and color show gross gamma concentration: the absolute call GEX plus absolute put GEX at that strike (position included when available). Dark blue = quiet strike; bright yellow-to-white = the heaviest gamma on the board. The colored sliver on the row’s left edge repeats the same scale so you can skim it even when scrolled. A small concentration trend arrow sits beside the bar — a secondary momentum glyph showing whether this strike’s concentration is rising, falling, or flat versus its last recorded reading. The bar is the primary signal; the arrow is just the direction of change. It only appears once two readings exist — never a fabricated flat.
- Strike — the SPX strike, plus left-side marker badges: Open marks the strike nearest the session’s opening print, and High and Low mark the session’s high and low with their percent distance from spot. These are position markers, not tags — they never take a row’s tag slot. Open only appears once the opening print exists; before then the ladder shows no Open badge rather than guessing one. The current price itself is the dashed spot price line with its price label — it moves live between rows instead of snapping to the nearest strike, while the nearest-strike row keeps a subtle amber highlight.
- Distance — signed points from spot. Positive is above, negative below. Use it to instantly judge “how far away is this level?”
- Flow GEX / Position GEX / Net GEX — the three numbers above. Compare Flow against Position: a big Flow number on a small Position base means today’s trading built this level; the reverse means it was already there this morning.
- Reason — the ladder’s one-tag summary of the row’s structure (next section).
The heatmap ranks importance, not direction. A bright bar says “a lot of gamma
lives here” — it does not say bullish or bearish. Read the sign of Net GEX and
the tag for direction-of-effect.
The Reason Tags
Most rows carry no tag — and that is the point. A blank Reason is the default: it means the strike is below the significance gate right now, so the ladder leaves it quiet rather than labeling background noise. A tag only appears on a strike the ladder judges genuinely significant, so a typical session shows just a handful of tagged rows — the flips, one or two resistances and supports, maybe a pin or a cliff — instead of a wall of labels. Silence is the signal; the numbers stay visible on every row regardless. How a strike earns a tag (the eligibility gate). Structural tags are reserved for the ladder’s most concentrated strikes: a strike qualifies only if it ranks near the top of the board by gross gamma concentration and carries at least a quarter of the day’s heaviest concentration. Everything below that gate stays blank. Two exceptions are deliberately gate-exempt because they are location facts, not strength claims: the two flip rows (Zero Gamma, Flow Flip) always mark their strike, and the OI Wall badge can ride along on an otherwise-blank row. Call Resistance and Put Support are capped per side. To keep the ladder readable, each side marks at most two strikes: the nearest qualifying strike to spot carries the primary tag, and the single strongest-by-concentration qualifying strike (when it is a different strike) carries a compact secondary badge with the same label. No third strike is promoted into an empty slot. When a strike does earn a tag, it shows the single strongest condition that applies:
The row nearest spot carries no special tag — it is marked by the row highlight and
the live spot price line instead, leaving its tag slot free to show any real
structure it happens to earn (the spot-adjacent row can also be a Pin Zone, for
example).
Two tags are deliberately kept separate because traders often confuse them:
Zero Gamma comes from open interest and is recalculated with current Greeks all
session (0DTE gamma decays fast, so a static morning level would drift wrong).
Flow Flip comes only from today’s trade flow. When they sit at different
strikes, the market’s existing structure and its fresh activity disagree about
where the balance point is — worth knowing, not worth papering over.
Tags are structure labels, not alerts or recommendations. They describe where the
strike map looks anchored, conflicted, or thin — the judgment stays with you.
Which Strikes You See: the Display Band
The ladder shows only the strikes that matter around today’s price — a 9000 strike is noise when SPX opened near 6300. By default it displays strikes within ±20% of the session’s opening print and hides the far tails. A small line at the top of the panel tells you which band is active:- “Showing strikes within ±20% of session open” — the normal intraday state, once the opening print exists.
- “Showing strikes within ±20% of prior close (provisional until the opening print)” — before the open, the band anchors provisionally to the prior session’s close and says so; it re-anchors to the real open once trading begins.
- “Showing the full strike chain (band anchors at the opening print)” — when no anchor is available yet, nothing is hidden; the full chain is shown honestly rather than guessing a band.
The band is a display filter only. The underlying record and the captured history
always keep the full strike chain — nothing is deleted, only hidden from the live view to
keep it scannable.
Hover a Row: the Strike Popover
Hovering (or keyboard-focusing) any row opens the strike detail popover — the ladder’s microscope. Press Escape to close it.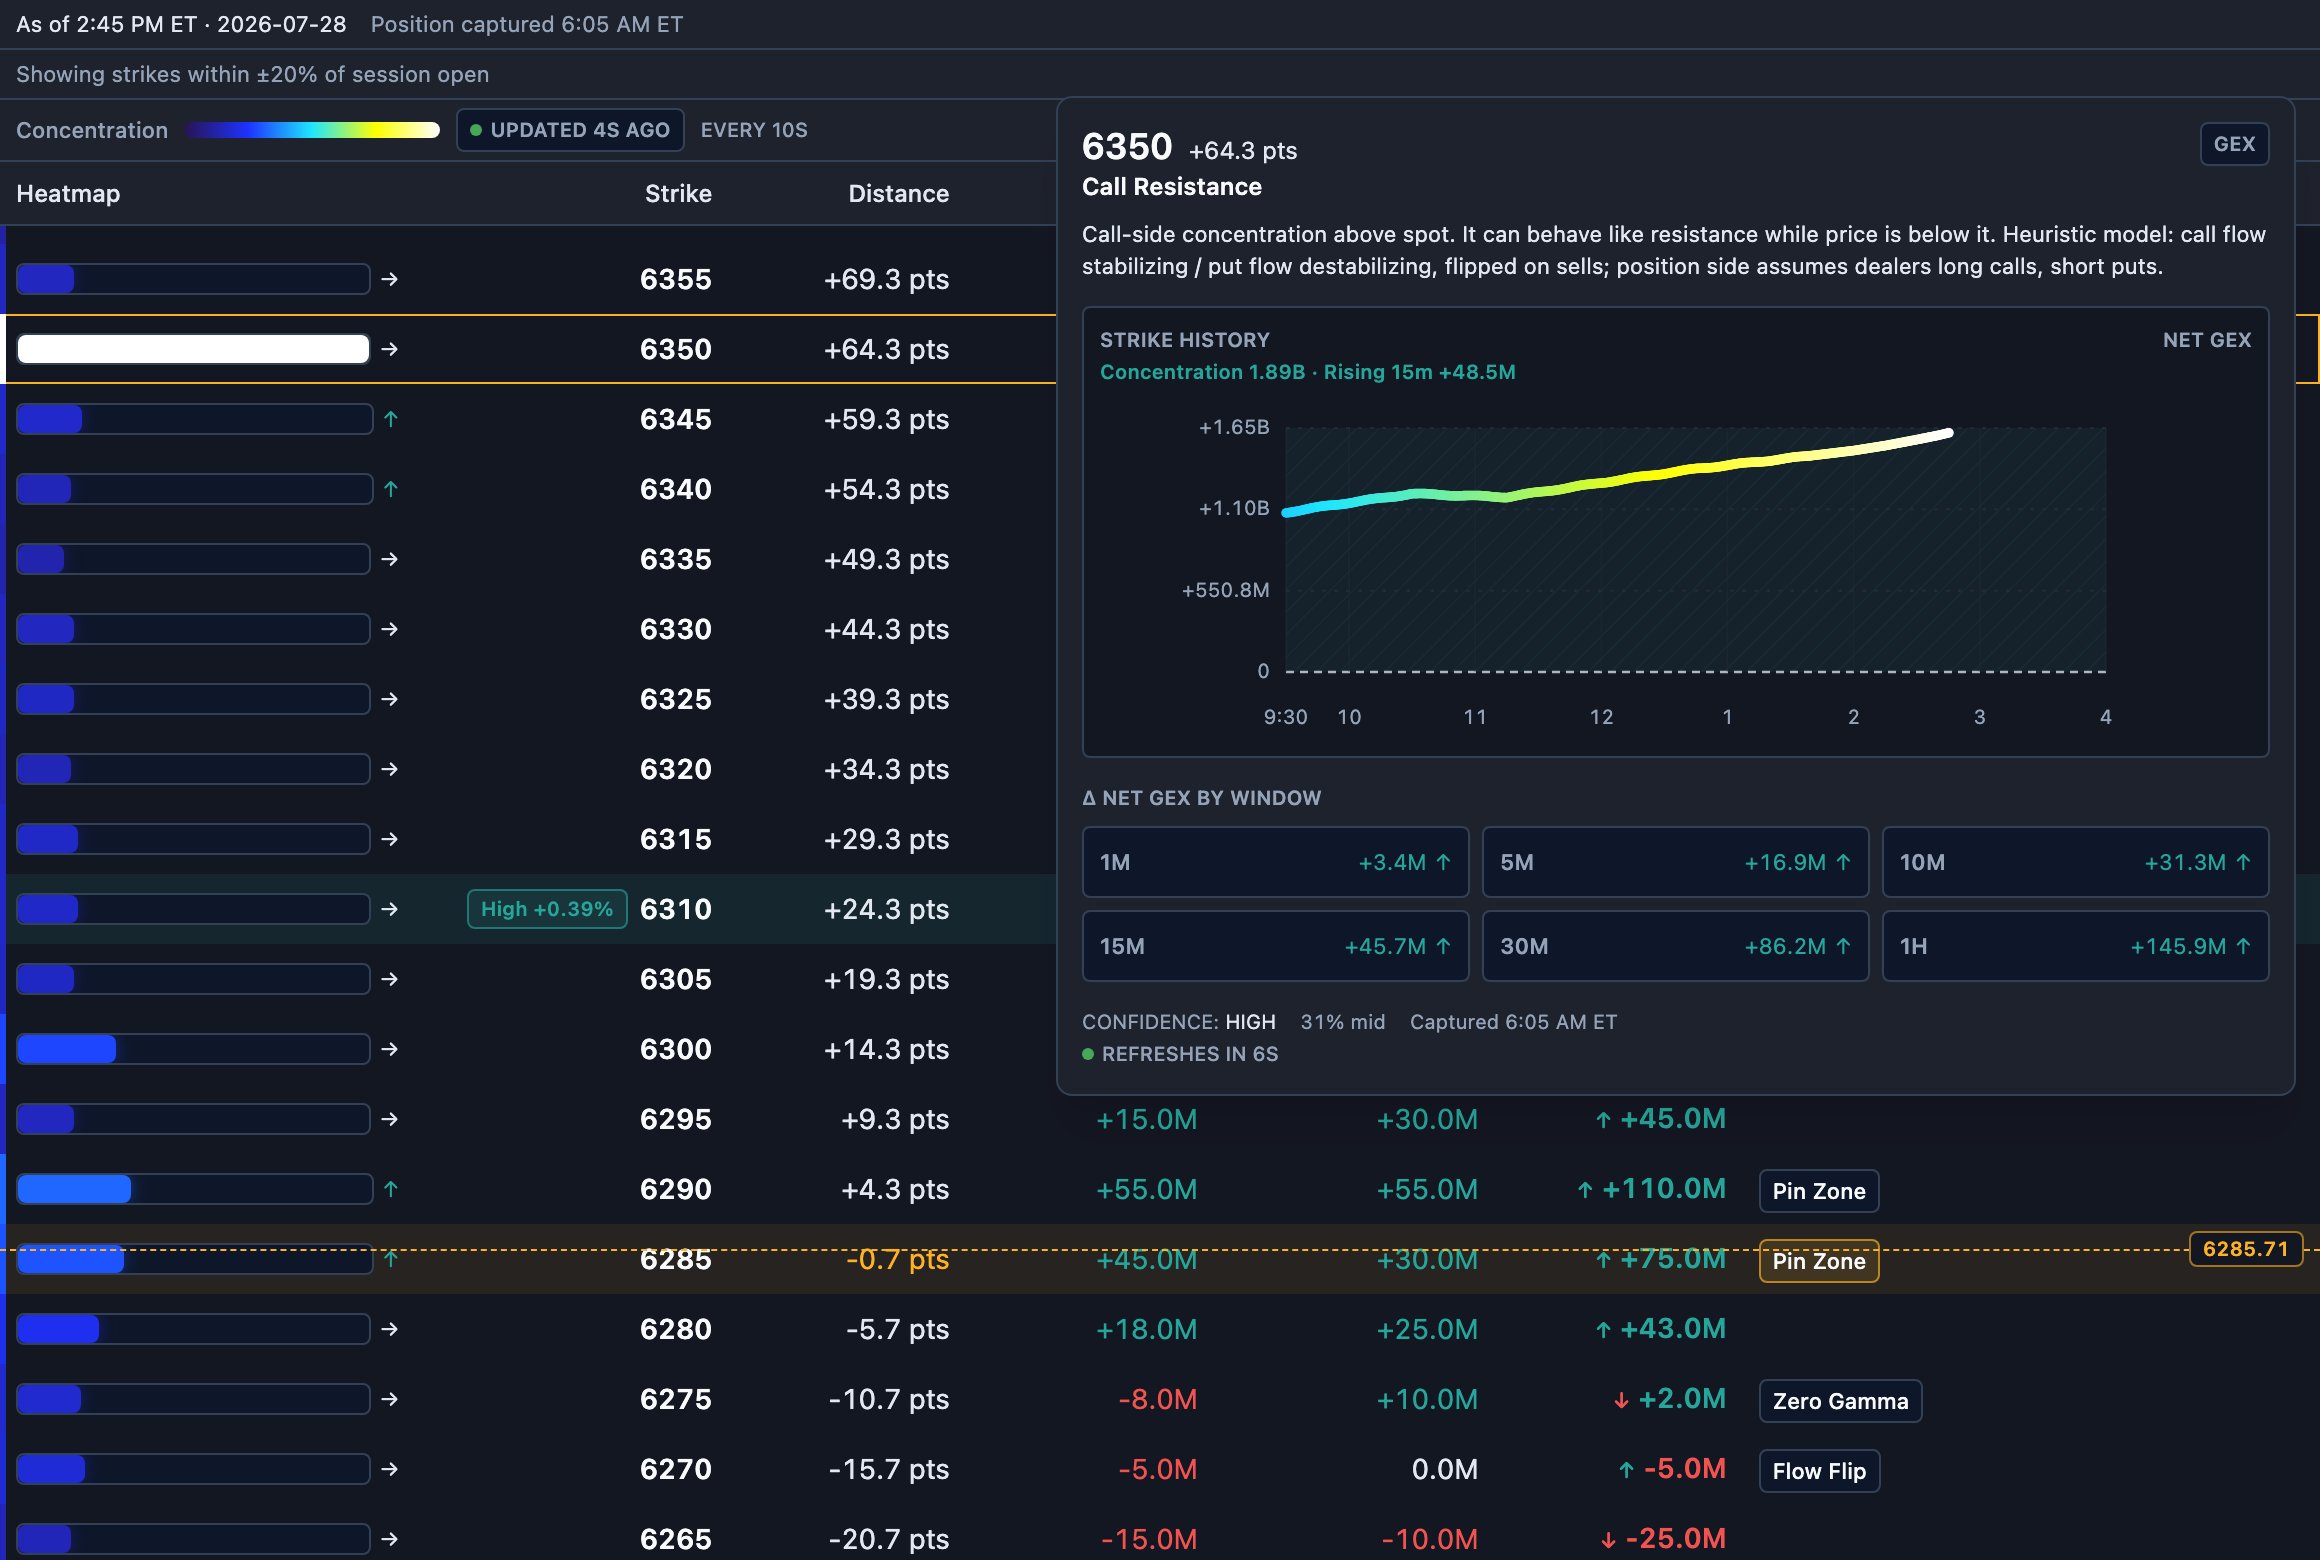
- Header — the strike, its distance from spot, its primary tag, and a plain sentence explaining what that tag means, including the modeling assumptions behind it (see Honest limits below).
- Strike History — Net GEX at this strike, sampled every 10 seconds across the regular session (9:30–4:00 ET axis). Each dot is a frozen snapshot recorded the moment it happened — history never gets repainted. The line’s color is the strike’s gamma concentration at that moment, on the same blue-to-white scale as the table heatmap: a line that brightens into the afternoon is a strike gaining importance. The green-shaded region above zero and red-shaded region below zero show the stabilizing vs. destabilizing regime at a glance.
- Concentration readout — the current gross concentration and its momentum (“Rising 15m +12.2M” means concentration grew 12.2M over the last 15 minutes).
- Δ Net GEX by window — how much Net GEX changed over the trailing 1m, 5m, 10m, 15m, 30m, and 1h. Green ↑ means gamma is building at this strike, red ↓ means it is draining, → means no meaningful change. Early in the session, longer windows show an em-dash until enough history exists — an honest “don’t know yet,” never a fabricated zero.
- Confidence footer — the position snapshot’s confidence level, the share of this strike’s flow that printed mid-market (“31% mid” — higher means weaker buy/sell attribution), the snapshot capture time, and a live countdown to the next refresh.
Freshness, Refresh, and Status Banners
The ladder tells you exactly how fresh what you’re reading is:- The top line shows As of (the data’s own timestamp) and Position captured (when the open-interest snapshot was taken).
- The legend badge shows how long ago the data last updated, and live views refresh every 10 seconds. Historical dates load once from cache instead of polling.
- If a refresh starts failing, data ages past two refresh cycles, or spot becomes unavailable, a single status banner appears above the rows stating what is wrong, and visibly stale data is dimmed. On weekends the ladder labels itself Prior session with the date it is actually showing.
- In the 4:00–4:15 PM ET settling window right after expiration, both flip rows (Zero Gamma and Flow Flip) are hidden rather than shown at a meaningless value.
Flow-Only Dates
When the payload has no position snapshot — most historical dates — the ladder still works, but it changes honestly rather than silently: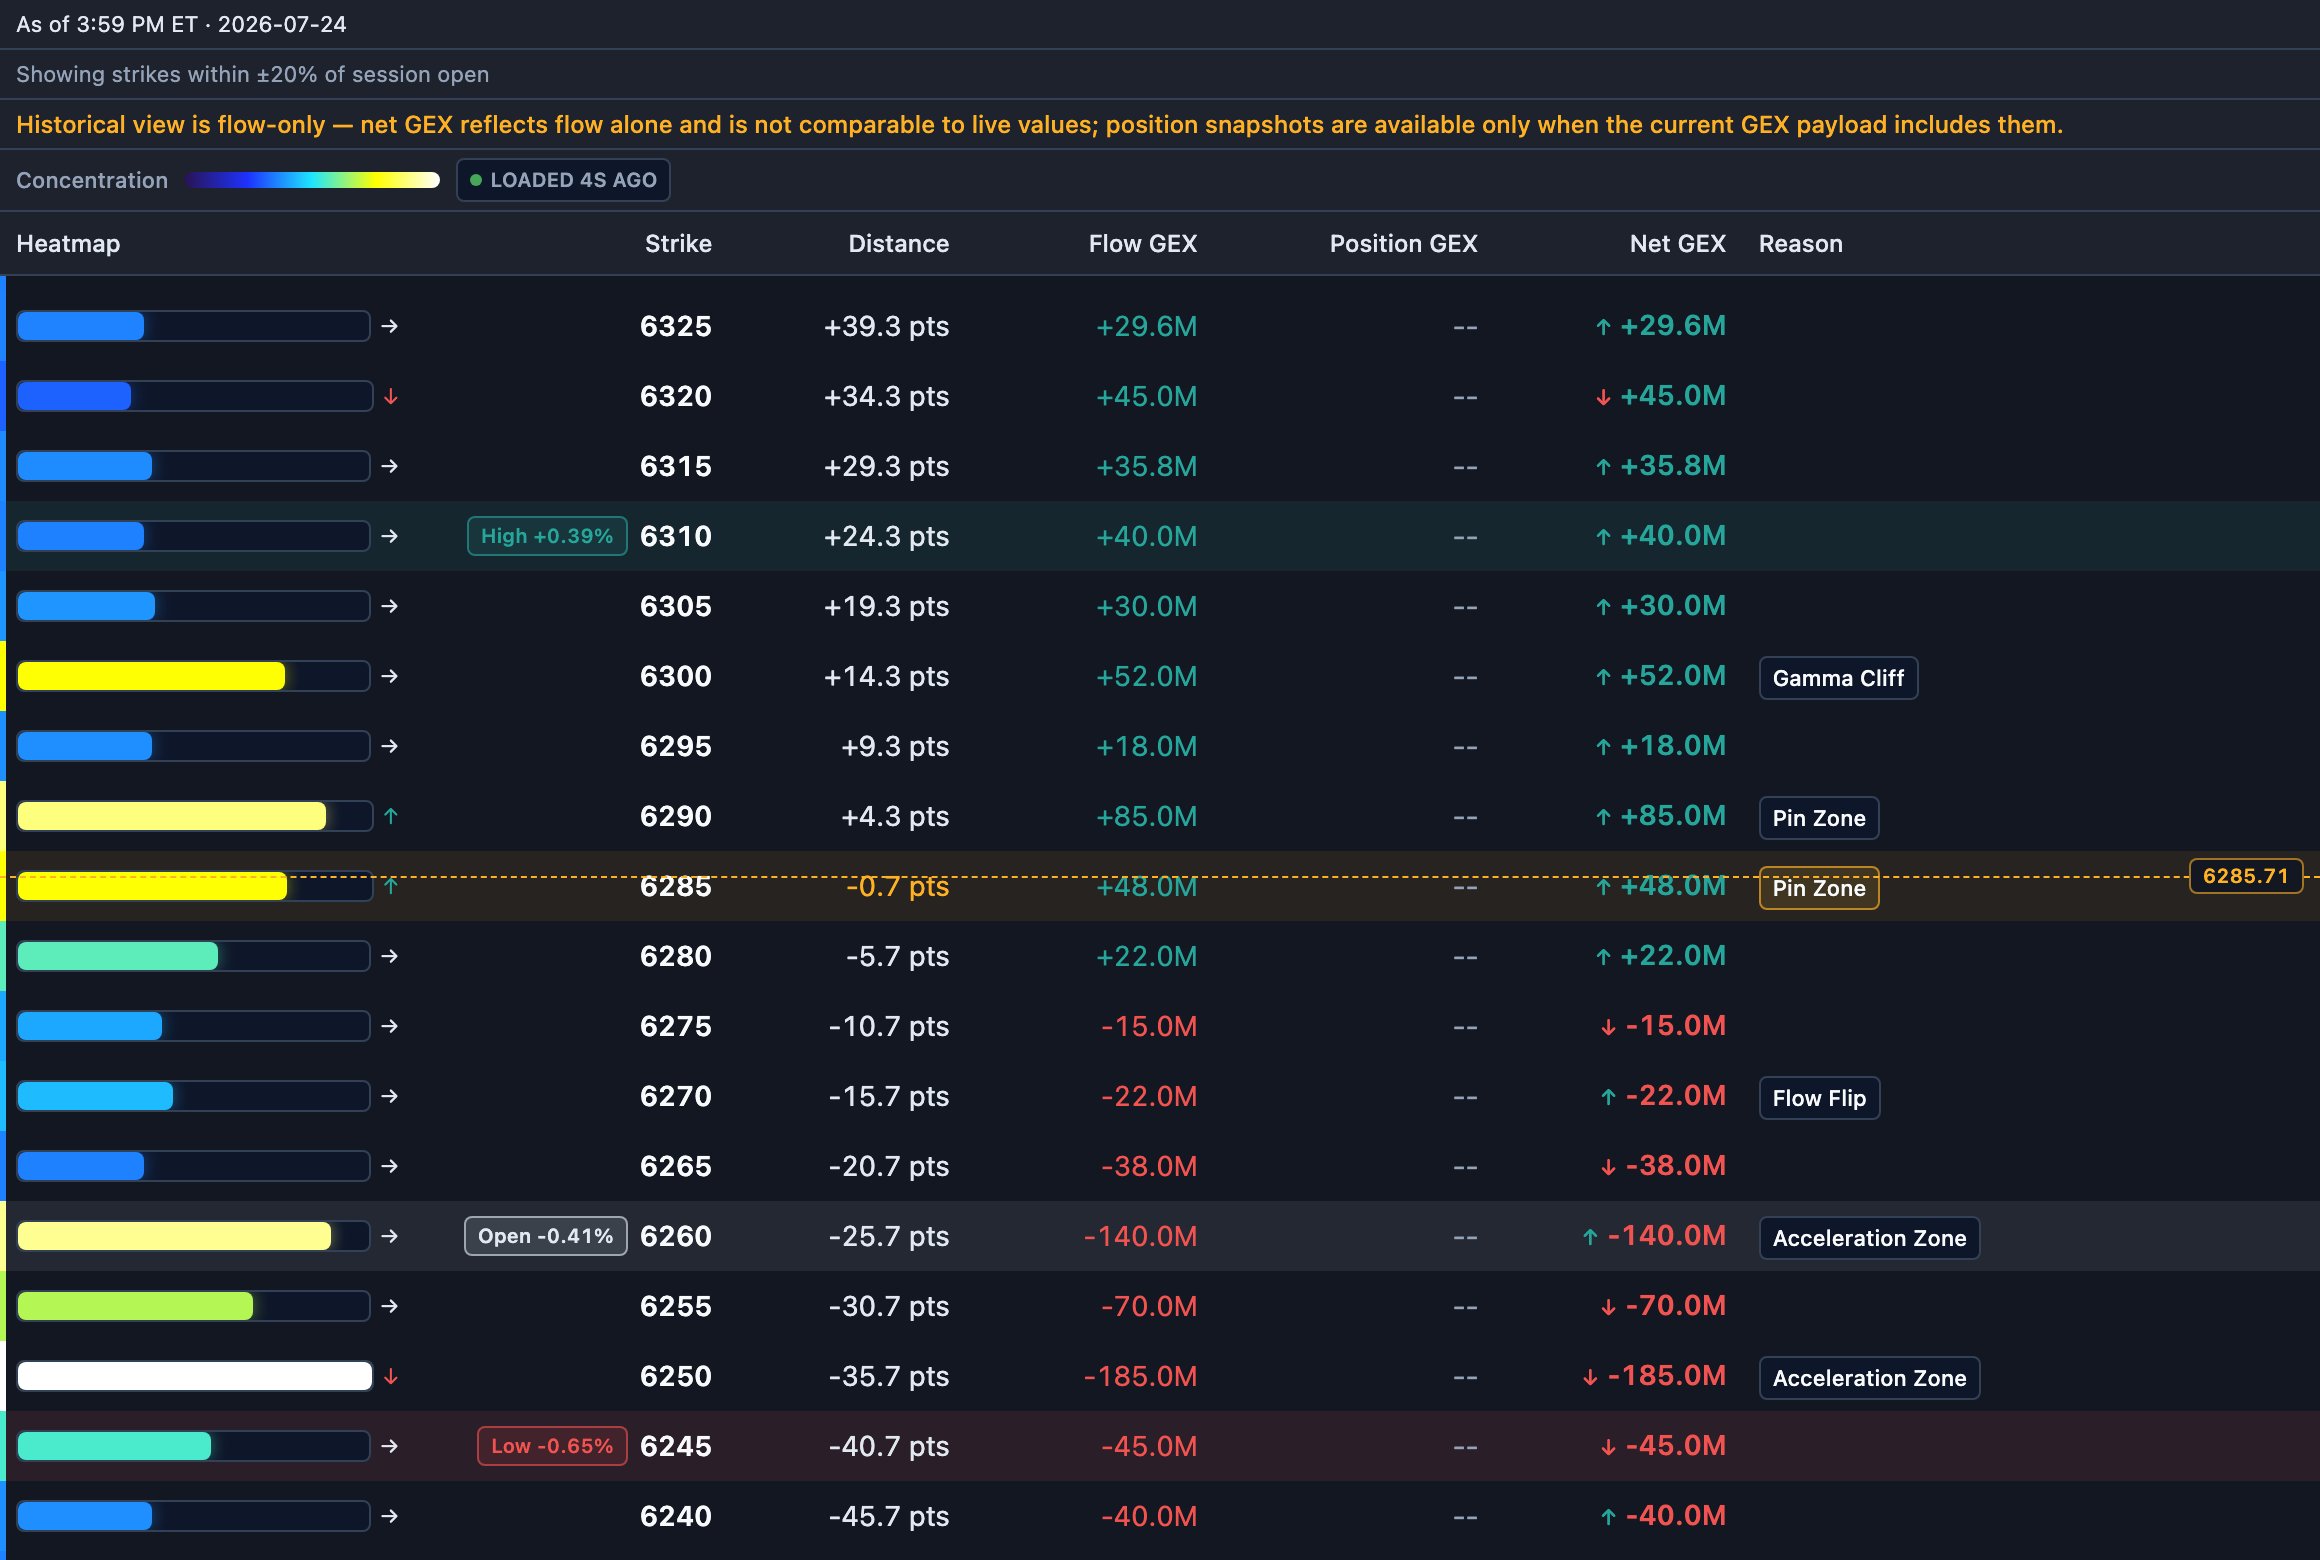
--, Net GEX equals Flow GEX alone, and
the banner says so explicitly.
- Position GEX displays
--and Net GEX equals Flow GEX - A banner states the view is flow-only
- Zero Gamma disappears (it needs open interest); Flow Flip remains
+660.0M Net GEX on a live day (flow +
position) is not comparable to +260.0M on a flow-only historical day. Same
column, different ingredients.
Why It Helps
Without the ladder, answering “what happens if SPX trades up 15 points from here?” means reading a chart, estimating strikes, and holding the GEX sign conventions in your head. The ladder answers it directly: look 15 points up, read the tag. It supports three everyday decisions:- Framing the range — the nearest Call Resistance above and Put Support below give you the day’s working boundaries, and Pin Zones tell you where price may stall.
- Judging speed — Acceleration Zones and the space past a Gamma Cliff are where moves can extend; heavy positive rows are where they tend to slow.
- Separating new from old — Flow vs. Position shows whether a wall was built today (and could unwind just as fast) or is anchored in standing open interest.
How To Use It Well
1
Start at spot and read outward
Find the Spot row, then scan up for the first Call Resistance and down for the
first Put Support. Note the Distance values — those are your working boundaries.
2
Rank by heatmap, act by tag
The brightest rows are the load-bearing strikes. For each one, read Net GEX and
the tag to know whether it is likely to dampen or accelerate movement.
3
Hover the strikes you care about
Before treating a wall as solid, open its popover. A Call Resistance whose Δ Net
GEX windows are all red is draining; one that is green and brightening is being
reinforced. The history chart shows whether the level held its character all day.
4
Cross-check with the other GEX views
Confirm the ladder’s key levels against the GEX Combined
curve, watch GEX Interval for where new gamma is being added,
and use Net Drift / Net Flow for the
directional lean. Agreement across views is worth far more than any single read.
5
Re-check before the close
0DTE structure decays and migrates fast. A wall from 11 AM may be gone by 3 PM —
re-read tags and re-hover key strikes before assuming they still matter.
Common Misreads
- “Bright heatmap = bullish.” No — the heatmap is gross gamma mass, direction-blind. A huge put strike and a huge call strike both glow. Read Net GEX’s sign and the tag.
- “Put Support means price can’t go lower.” It marks concentration that can behave like support — and if price breaks it, movement can get faster, not slower.
- “Zero Gamma and Flow Flip are the same thing.” They come from different data (open interest vs. today’s flow) and often sit at different strikes on purpose.
- “
--is zero.” An em-dash means not measured (no snapshot coverage, or no 0DTE flow at that strike).0.0Mmeans measured-and-flat. The ladder never fabricates a zero. - “Historical Net GEX compares to today’s.” Historical dates are usually flow-only; the banner tells you. Compare like with like.
- “Conflict means bad data.” It means the measurements disagree — which is itself information: skip that row or demand confirmation elsewhere.
Strengths and Limitations
Where the ladder is strong- It is the fastest way to turn raw gamma data into named, strike-level structure — readable without interpreting a chart.
- It separates fresh intraday flow from standing open interest instead of blending them, so you can tell new walls from old ones.
- It is honest about uncertainty: missing data shows as
--, degraded inputs and mid-heavy flow lower a row’s stated confidence, and staleness is bannered rather than hidden. - Per-strike history and Δ windows let you watch a level being built or abandoned in near real time (10-second refresh).
- The directional read is a heuristic model, not a measurement of actual dealer inventory. It assumes call flow stabilizes and put flow destabilizes (flipped on sells), and that dealers are long calls and short puts. When those assumptions are wrong, tags can mislead.
- Mid-market prints (often a third or more of volume) carry no buy/sell information, so they count toward concentration but contribute zero to signed Net GEX. A mid-heavy strike’s directional read is soft — the popover’s ”% mid” tells you when.
- It covers SPX 0DTE only. Longer-dated positioning and other products are invisible to it.
- Data refreshes every 10 seconds, not tick by tick, and describes hedging-pressure context — it does not predict direction, and levels can fail outright on strong news-driven moves.