
What You’ll Learn
By the end of this guide you will be able to read every part of the Quote Flow chart — the bubbles, the bottom quoted-size strip, the right-side profile, the heatmap modes, and the plotted levels — plus drive live mode, replay, zoom, and the settings that shape all of it.What Quote Flow Is
Quote Flow is Hermes’ live map of cumulative 1-second NBBO quote data for SPY or QQQ. Every second, Hermes accumulates the size quoted at the national best bid and best ask, buckets it by price, and draws it as a bubble. The result is a picture of where visible quoted liquidity is sitting and leaning — second by second, level by level.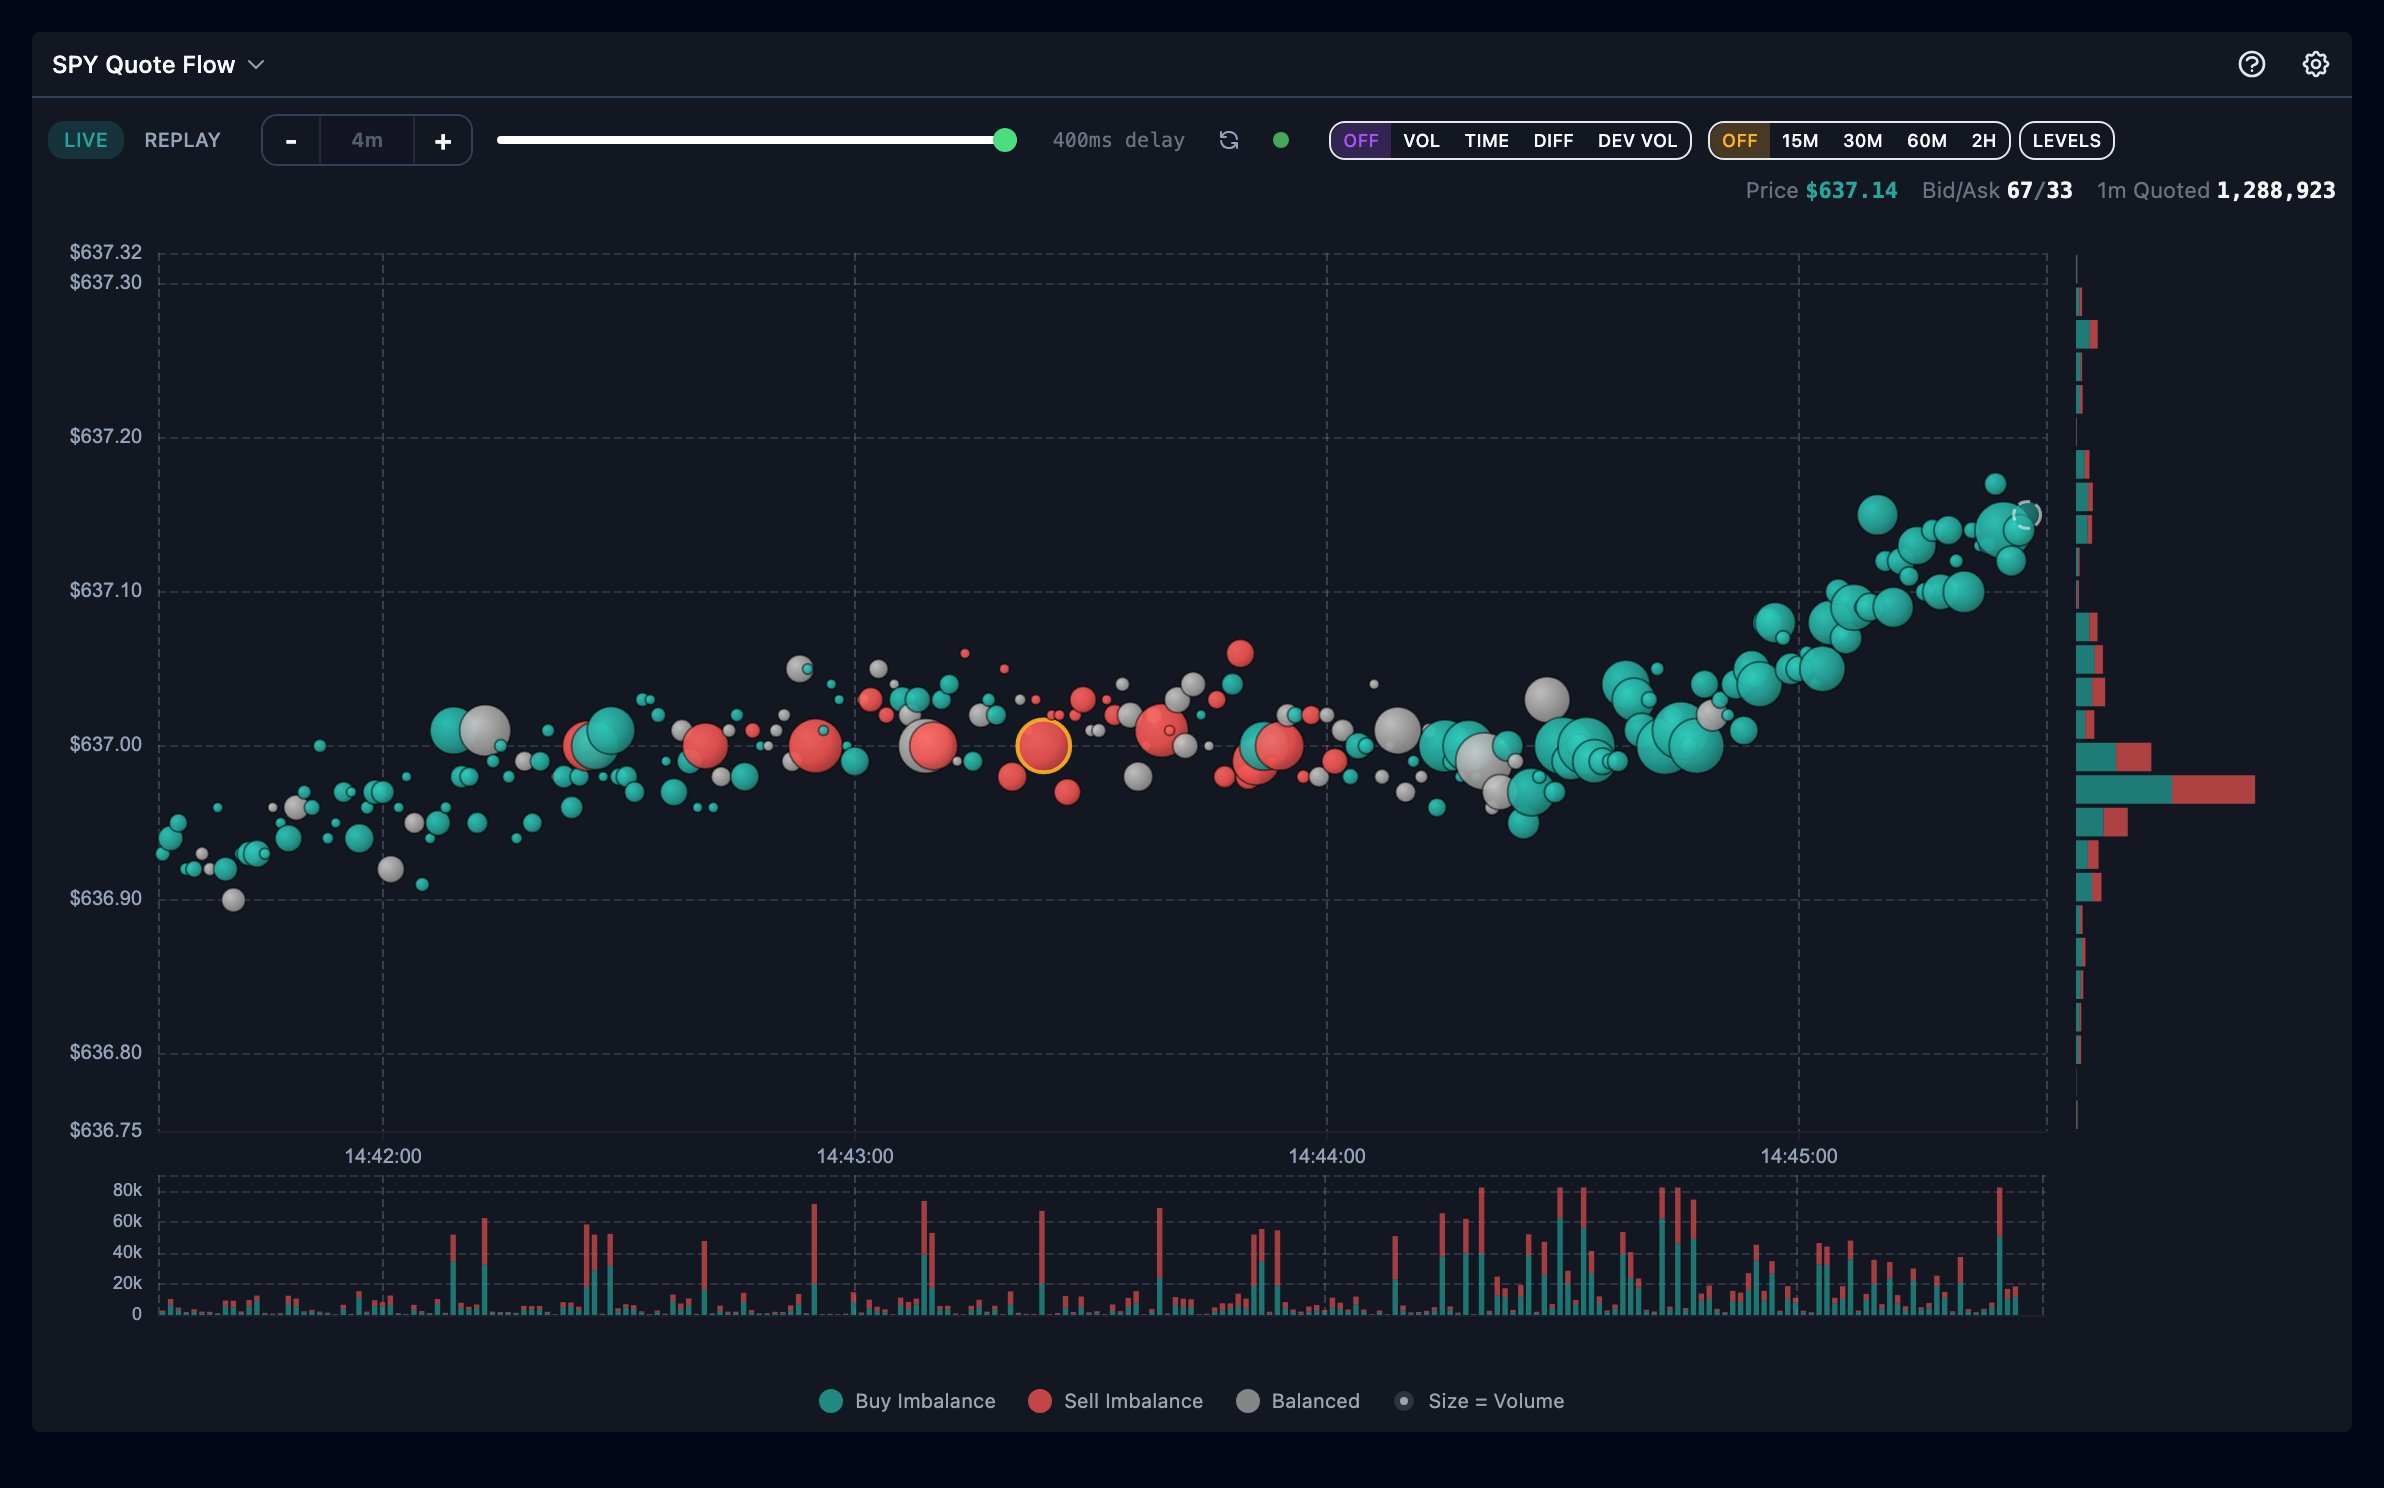
The Chart at a Glance
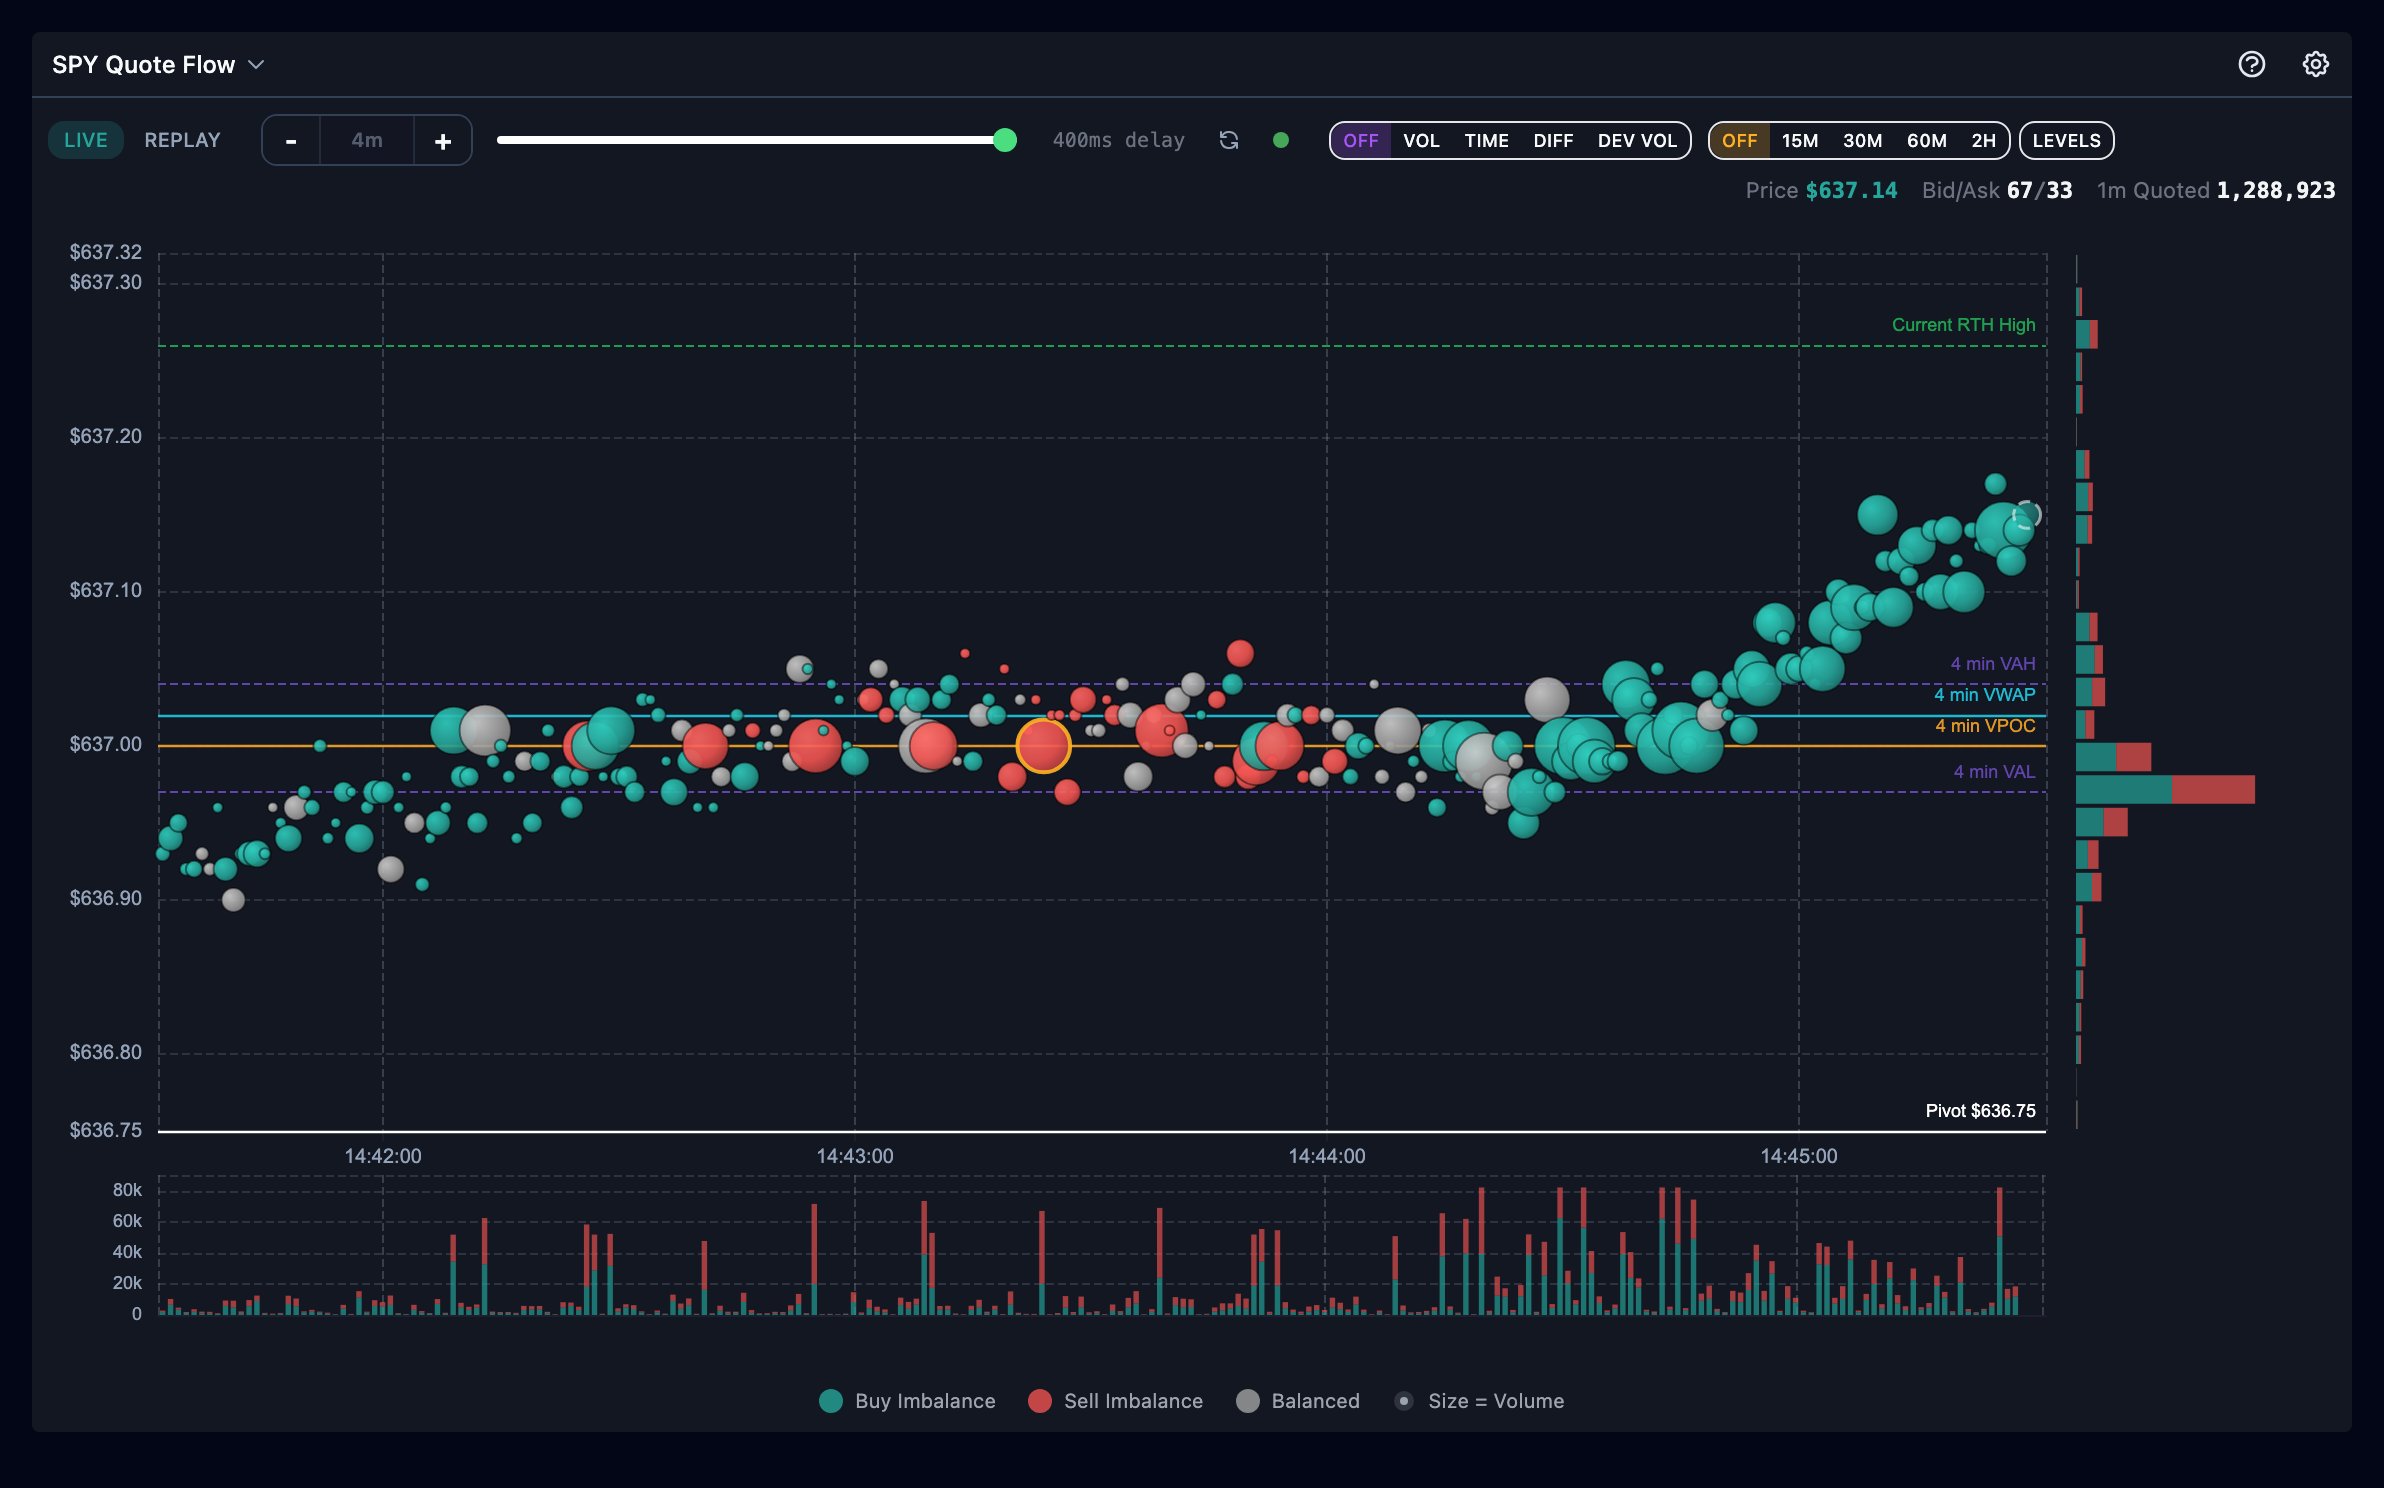
The view is three linked panels drawn from the same 1-second buckets:
The readouts in the top-right corner track the essentials live: the current
Price (tinted by the last minute’s lean), Bid/Ask — the bid share vs ask
share of quoted size over the trailing 60 seconds — and 1m Quoted, the total
quoted size over the same minute. A small latency chip (e.g. “400ms delay”) and
a connection dot sit in the toolbar so you always know how live “live” is.
Reading a Bubble
Every bubble encodes four things:- Position — the price where quoted size accumulated during that second.
- Size — cumulative quoted NBBO size for the second. Sizing is perceptual (roughly a power curve), so a bubble twice the diameter carries far more than twice the size.
- Color — the lean of that size (colors follow your theme; defaults shown):
- Teal-green — bid-heavy (more than ~55% of the quoted size sat on the bid)
- Red — ask-heavy (more than ~55% sat on the ask)
- Gray — balanced, no meaningful lean
- Border — the bubble’s state:
- A dashed white border marks the forming bubble — the in-progress second in live mode, or the playback cursor’s active second in replay.
- An orange border marks absorption — heavy quoted size that held its level while price pressed into it, visible liquidity standing its ground.
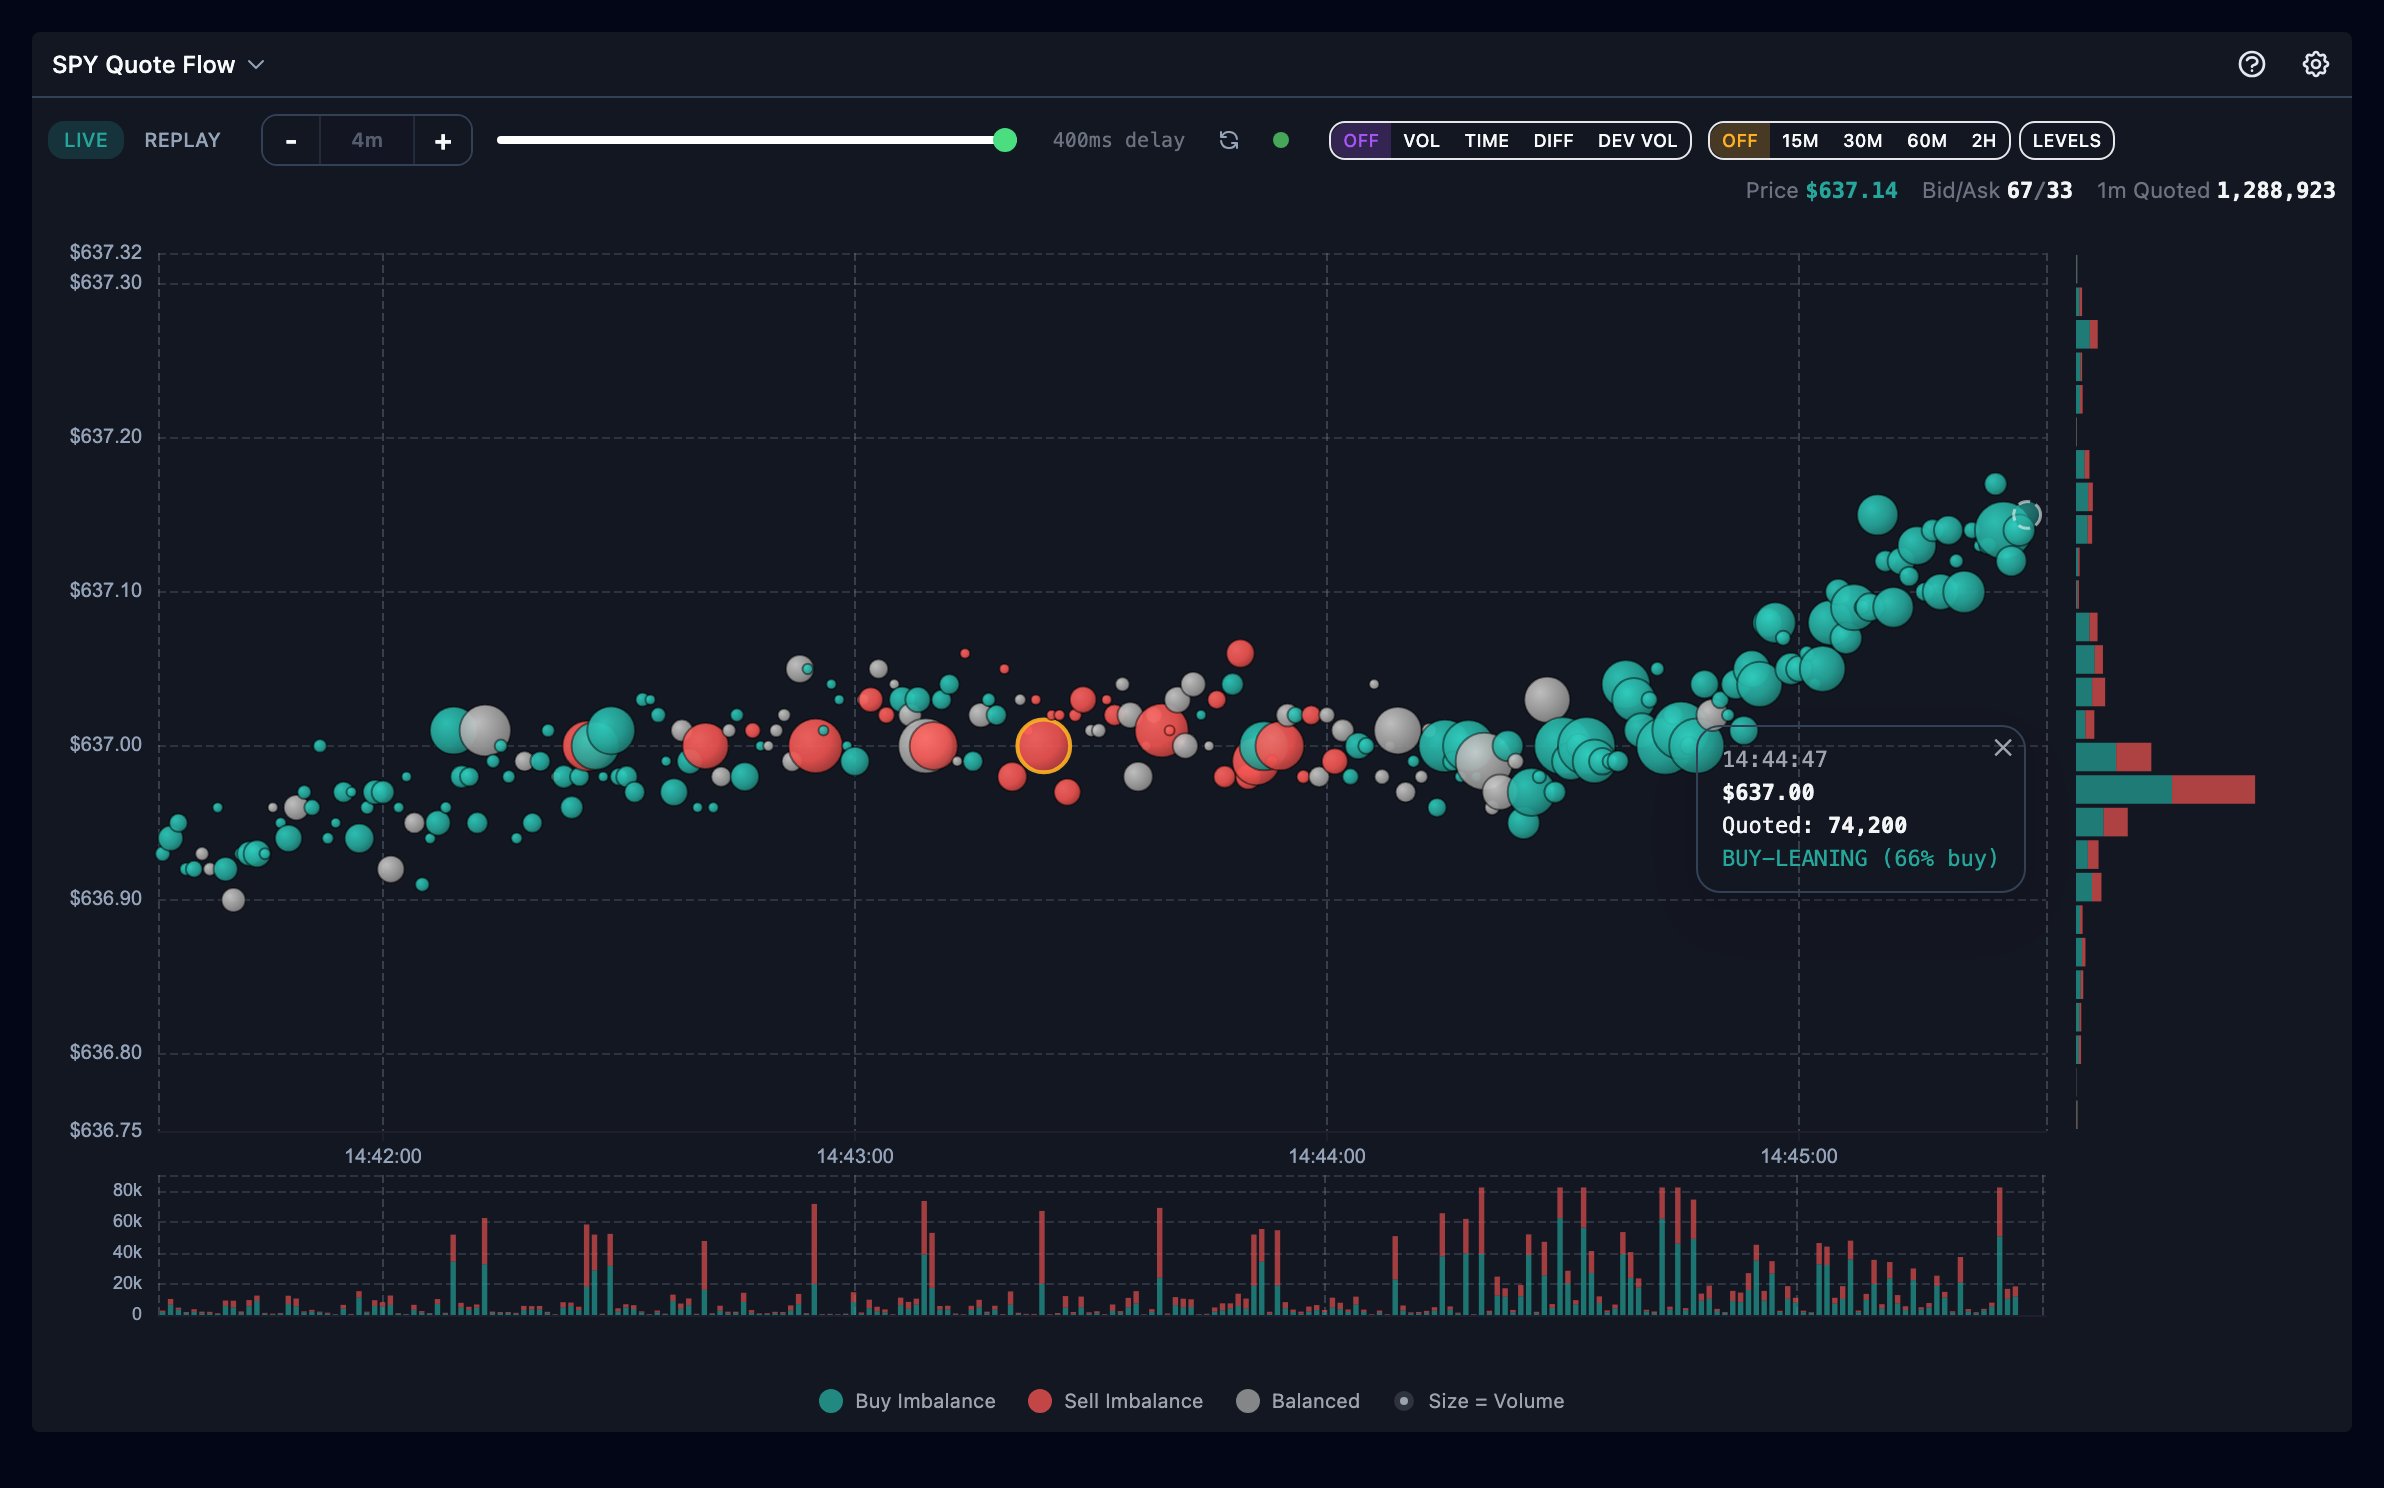
One bubble is one second — treat it as a syllable, not a sentence. The readable
signals are clusters (repeated large bubbles at one level), persistent
leans (the same side winning second after second), and profile shelves,
always judged against how price reacts to them.
The Toolbar, Left to Right
Everything that drives the chart sits in the in-chart toolbar:Wider windows aggregate for readability: below 8 minutes you see raw 1-second
buckets; wider windows merge buckets into coarser time/price cells so the chart
stays legible. Bid and ask buckets are never merged together — the lean you see
is always real.
Heatmap Modes
The heatmap paints accumulated quoted size as a background surface behind the bubbles, so level memory persists even where bubbles have scrolled away: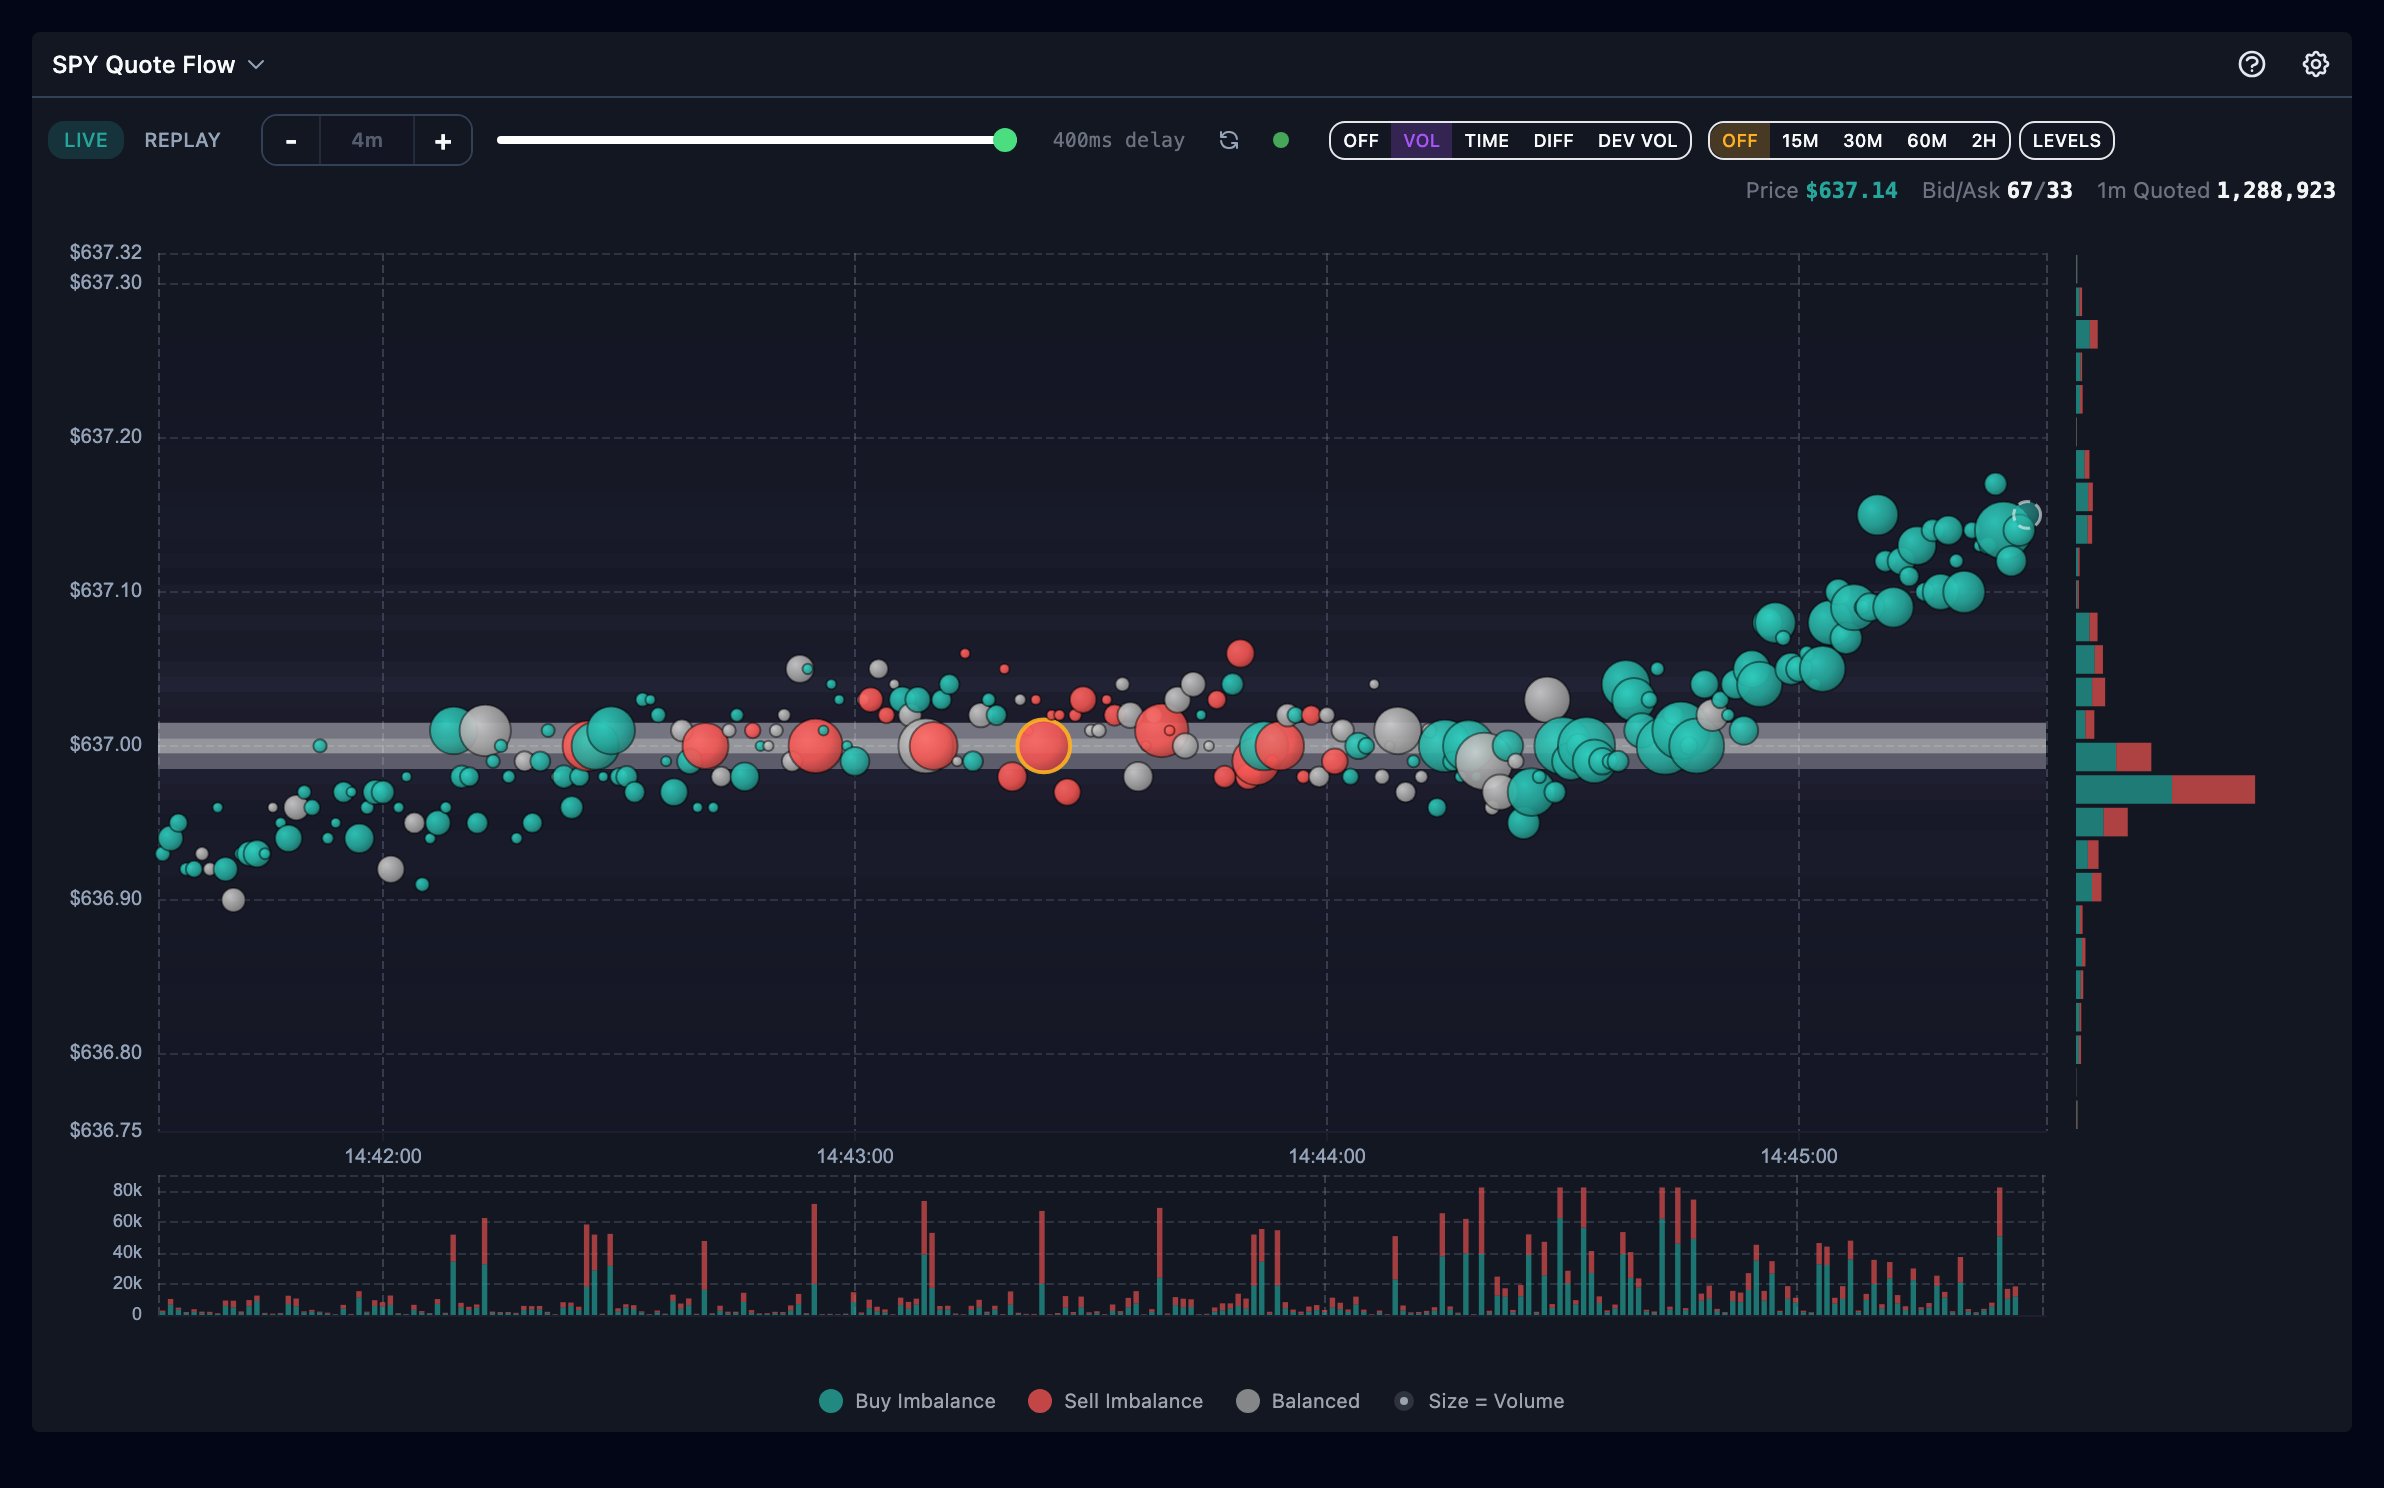
Decay applies a half-life to the accumulated surface and the profile. With
decay Off the window remembers everything; with a 15m half-life, old
size fades quickly so the surface tracks the current battleground. Shorter
half-lives suit fast conditions; longer ones suit slow, rotational days.
Plotted Levels
The LEVELS button controls the reference lines drawn on the chart: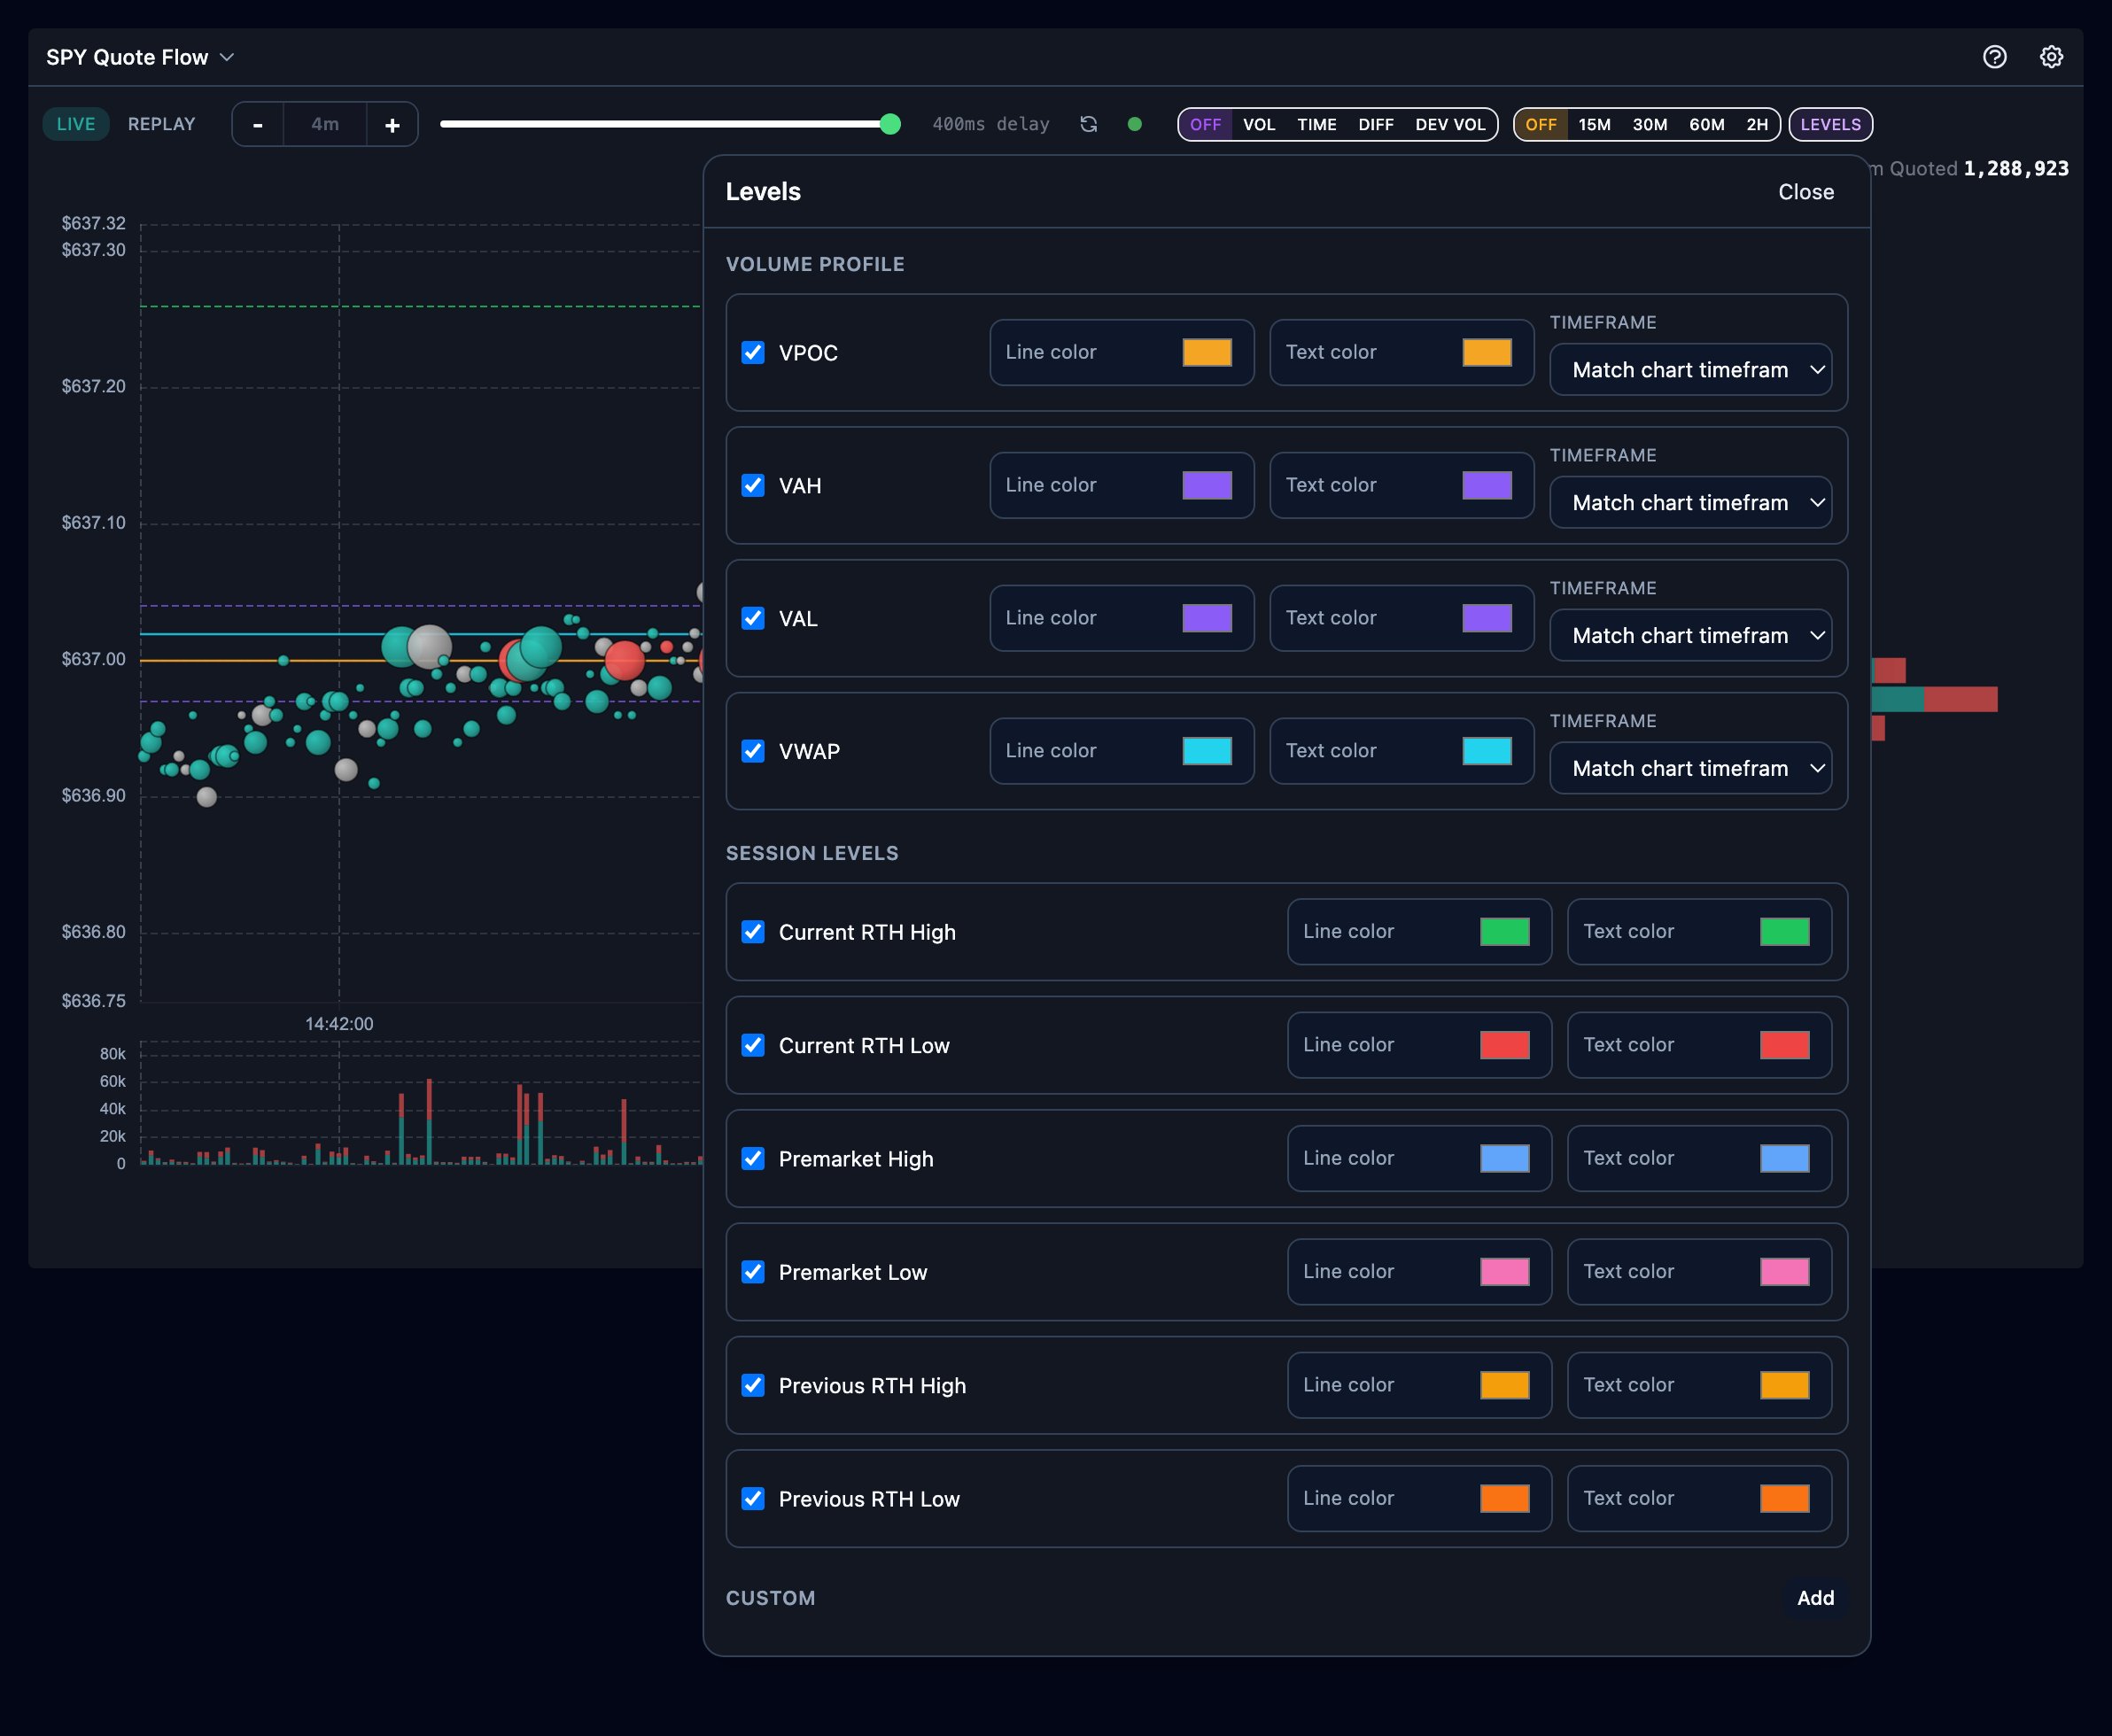
- VPOC — the price with the most accumulated quoted size (the point of control)
- VAH / VAL — the value area high and low around the VPOC
- VWAP — the quoted-size-weighted average price
- Current RTH High / Low — today’s regular-session extremes
- Premarket High / Low — the pre-9:30 extremes
- Previous RTH High / Low — yesterday’s regular-session extremes
Settings and Symbols
The panel’s gear menu holds the rest: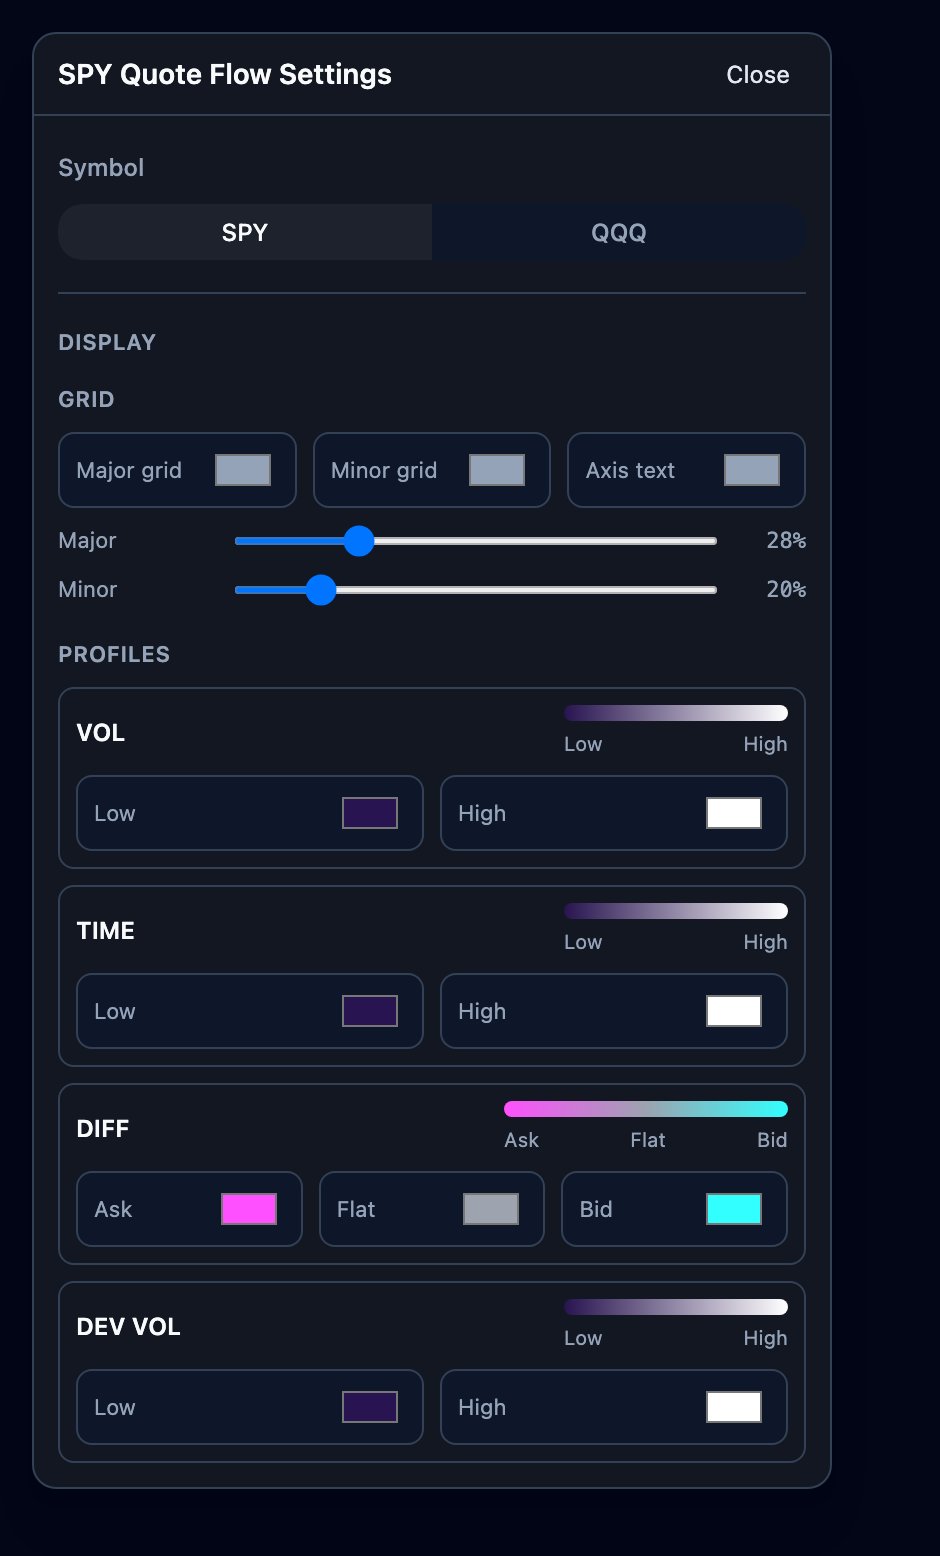
- Symbol — SPY or QQQ. The panel title follows (“SPY Quote Flow”), and each symbol remembers its own chart preferences.
- Grid — major/minor grid colors, axis text color, and opacity sliders.
- Profile gradients — the color ramps used by the VOL, TIME, DIFF, and DEV VOL surfaces, each with a live preview bar. DIFF is a three-stop ramp (ask → flat → bid) so you can tune how loudly the two sides separate.
?symbol=
parameter wins over the remembered symbol.
Live Mode
Live mode answers three questions in real time:- Is quoted liquidity clustering right now, and at which prices?
- Is the clustering bid-heavy or ask-heavy — and is the lean persisting?
- Is price accepting or rejecting the levels where size keeps appearing?
The Full Day Window
Full Day expands with the session. Its left edge is the current day’s 4:00 AM ET premarket open; its right edge is the live timestamp. At 10:00 AM it shows 4:00–10:00; at 2:30 PM it shows 4:00–2:30. It never reserves empty space out to the close.Replay Mode
Replay plays back a recorded session through the exact same rendering — bubbles, strips, profiles, heatmaps, and levels all work identically. Pick a date, press play, and use the speed presets and scrubber to move around. Replay is for training your read, and it rewards repetition:- Start from the open and watch where the first meaningful profile shelf forms.
- Note when quoted-size clusters and price agree — and when they diverge.
- Scrub back over fast turns and replay them at 1× after watching at 10×.
- Study failed breakouts: was the level thickly quoted before price rejected it?
How To Use It Well
1
Anchor on the profile, not the bubbles
Start each look at the right-side profile: where are the shelves, and where
is price relative to them? Bubbles tell you what is happening this second;
the profile tells you what the window has been building.
2
Wait for clusters and persistence
A single large bubble is noise. Repeated large bubbles at one price, or a
lean that keeps showing up second after second, is a level worth watching —
pin a tooltip on the biggest bubble to keep its exact size and lean in view.
3
Judge levels by price's reaction
Heavy quoted size at a level means nothing by itself — what matters is
whether price stalls, rejects, or slices through it. Absorption borders plus
a stalling price is the classic hold; heavy size that vanishes as price
arrives is the classic pull.
4
Use heatmap + decay to match the day
On fast days, VOL or DIFF with a 15–30m decay keeps the surface current. On
slow days, TIME with a long decay shows where the market is genuinely
accepting price.
5
Cross-check the executed side
Quoted intent and executed reality can disagree. Compare quoted size against
the volume that actually traded, shelf by shelf, in the
Quote Flow Profile.
Common Misreads
- “A big bubble means big buying/selling.” It means big quoted size. Until it trades, it is visible intent — and intent can be pulled.
- “Green bubble = price will go up.” Green means bid-heavy quoted size. It can be genuine support, or it can be size that disappears on approach. The reaction, not the color, is the confirmation.
- “The first cluster of the day is the level.” Opening clusters are often repriced within minutes. Let a level prove it recurs before leaning on it.
- “The profile is telling me about the whole day.” The profile covers the visible window (shaped by decay). A 4-minute window’s VPOC is a 4-minute story — pin levels to Full trading day when you want the session-wide read.
- “Replay proves the setup works.” Replay trains recognition. Finding a pattern after the fact is easy; the discipline is watching it fail, too.